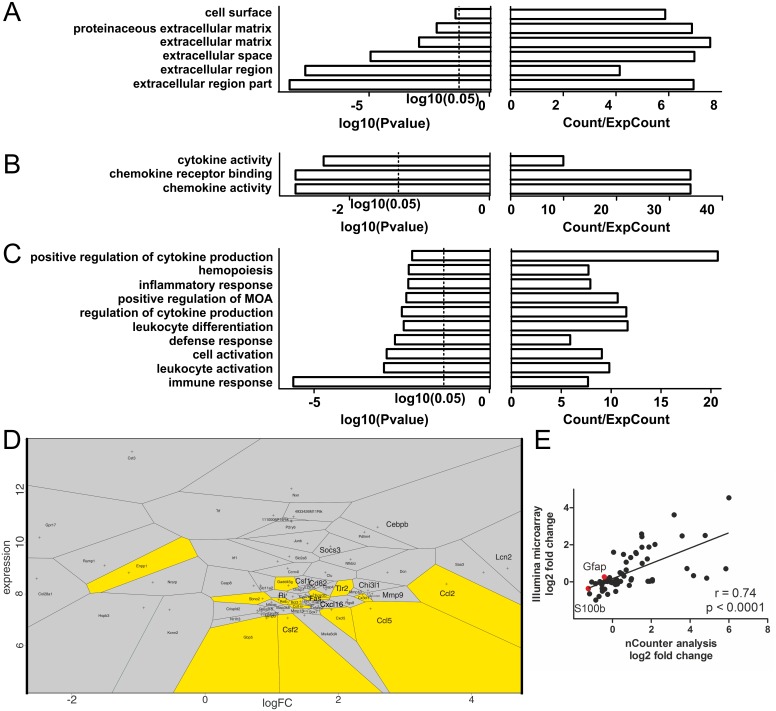
Fig 5. Significantly upregulated glial genes upon LPS stimulation are enriched in immunologic processes.
(A-C) Bar charts displaying significantly enriched annotations of differentially expressed genes referring to cellular compartments (A), molecular functions (B) and biological processes (C). The level of significance is given as logarithm (log10) of the p-value calculated using the Benjamini correction. Enrichment is given as the count of genes associated to the respective term in the dataset relative to the expected count (Count/ExpCount). (D) Voronoi diagram displaying each significantly differentially expressed gene. Genes are plotted based on their absolute expression level and the relative expression change in response to LPS treatment given as fold change. The plotting area is segmented and a field is assigned to each gene, its size represents the unique character of the expression parameters. Yellow coloring indicates association of a gene product to the GO-term “immune response”, which is enriched with the highest significance. Genes associated to this term include some of those with the highest fold-change increase upon LPS-stimulation. Increased labeling font size indicates validation of expression with the nCounter technology. (E) Spearman correlation of 60 genes analyzed with the Illumina microarray and the Nanostring nCounter technology. The Spearman coefficient of 0.74 shows highly significant correlation (p<0.0001) of the results obtained with both technologies. Data points for the glial marker genes Gfap and S100b are highlighted in red.

