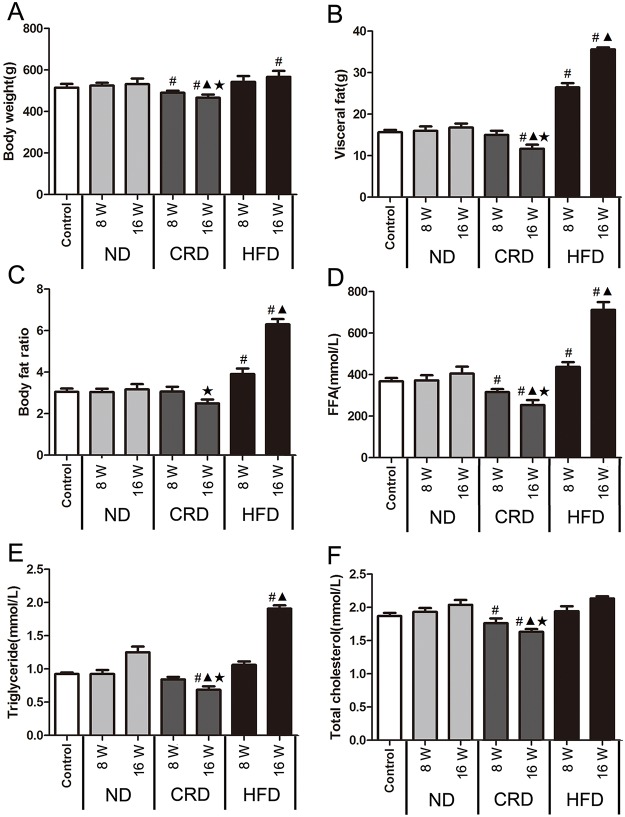
Fig 4. Changes in body composition and lipid levels in adult SD rats following dietary intervention (n = 5 for each group).
The body weight (A), visceral fat (B), body fat ratio (C), plasma FFA levels (D), plasma triglyceride levels (E), and total plasma cholesterol (F) in the ND, HFD and CRD groups at 0, 8 and 16 weeks. #: vs. 0 week, ▲: CRD/HFD vs. ND, ★ CRD vs. HFD. P<0.05. 0 weeks (14 months old), 8 weeks (16 months old), and 16 weeks (18 months old).

