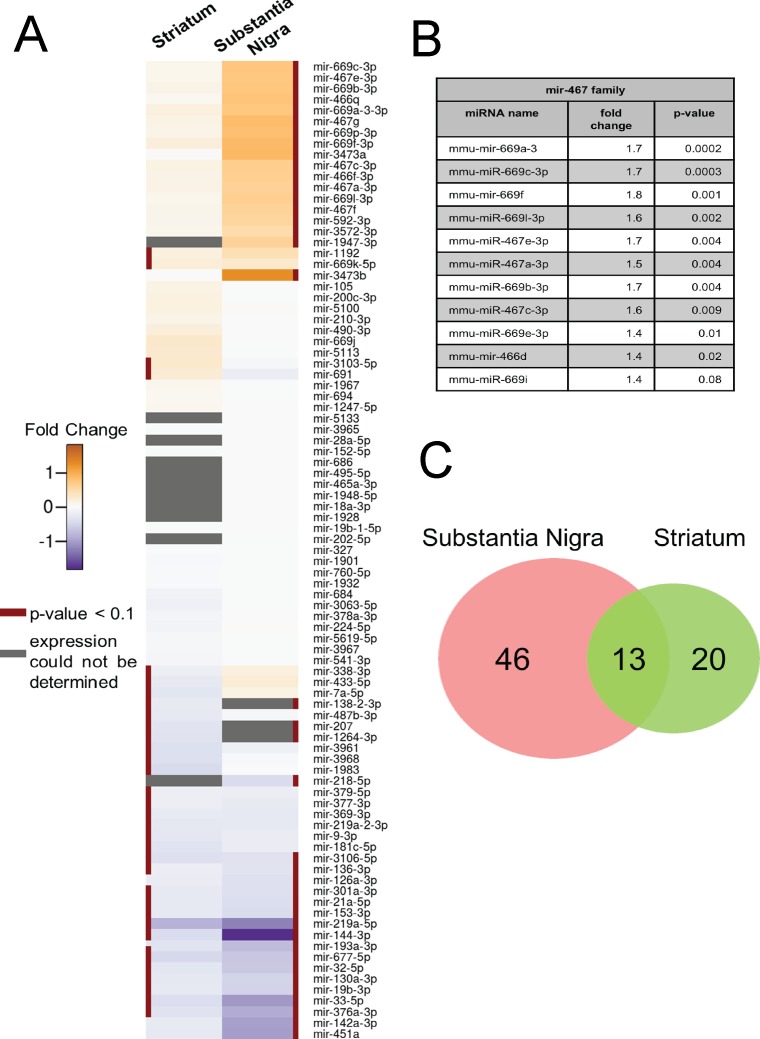
Fig 3. Differential expression of miRNAs in a mouse model of pre-motor stage MSA.
(A) Heatmap shows expression changes of miRNAs of striatum (left) and SN (right). miRNAs with statistically significant (adjusted p<0.1) changes are indicated by a red line on the side. Gray boxes designate miRNAs with expression signals below background. The color gradient shows positive and negative log2-transformed fold changes in orange and blue color, respectively. (B) Fold change and adjusted p-value of the miRNAs of the mir-467 family. (C) Venn diagram illustrates the overlap of differentially expressed miRNAs between SN and striatum in MSA mice. Differential expression analysis was performed by calculating a linear model for each miRNA according to the guidelines for simple dye swap experiments [39]. Duplicated spots were considered in the linear model fit. This model was then employed to obtain test statistics by the empirical Bayes method providing stable estimations for the sample variance of a small number of arrays [44]. All differentially expressed miRNAs with an adjusted p-value < 0.1 after multiple testing corrections as proposed by Benjamini and Hochberg were considered statistically significant [38].

