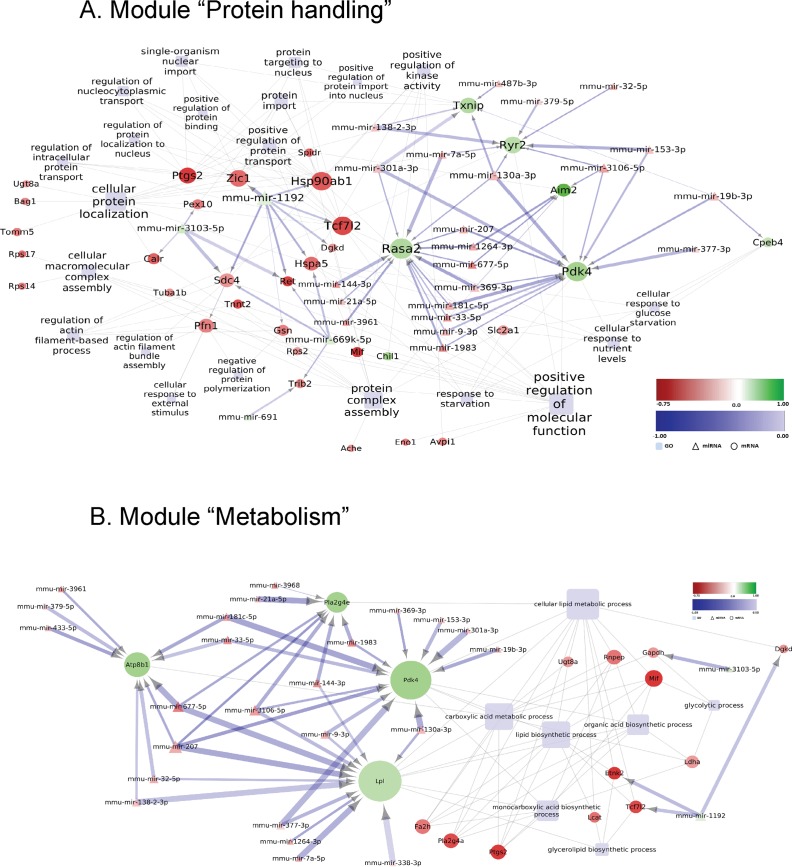
Fig 7.
Deregulated miRNA-mRNA regulatory network in the striatum of MSA mice in pre-motor stage of disease: Modules “Protein handling” (A) and “Metabolism” (B). Differentially expressed miRNAs with predicted negatively correlated differentially expressed mRNA targets assigned to the indicated GO-terms (light blue rectangles) are visualized by employing Cytoscape (version 3.2.1). Round nodes designate mRNA and triangle nodes miRNA. Node size is proportional to its degree. Fold change (log2 transformed) for each node is ranging from -0.75 (red) to 1 (green). The shade of blue color of the interaction arrows indicates the degree (range -1.00–0.00) of negative correlation between miRNA-mRNA target 3’ UTR interaction. Interaction arrow thickness is proportional to the number of algorithms predicting the miRNA-mRNA target 3’ UTR interaction, ranging from one to four.

