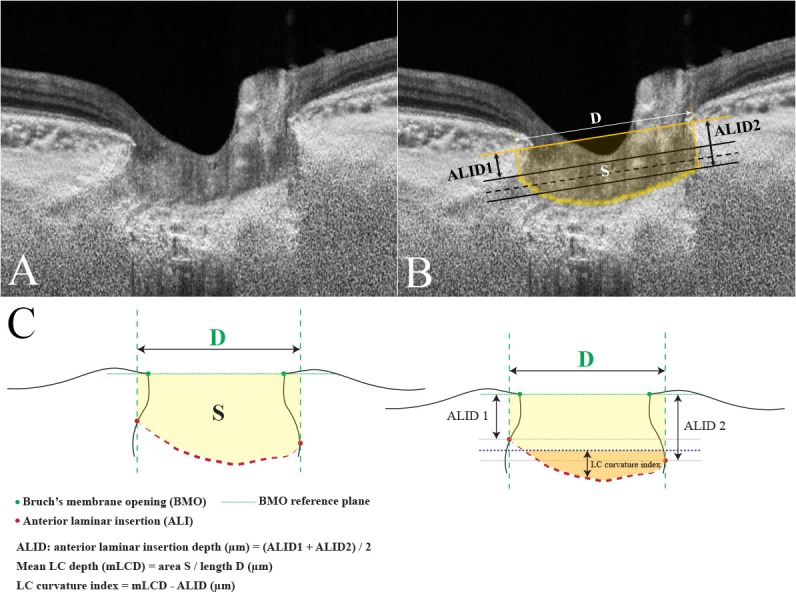
Fig 1. Measurement of the lamina cribrosa (LC) curvature index using swept-source optical coherence tomography (SS-OCT) scans.

The optic disc scan performed by SS-OCT without (A) and with (B) guidelines. The line connecting the two Bruch’s membrane openings (BMOs) is selected as the reference plane. The anterior LC surface has been manually depicted as a yellow dotted line (B). The two vertical lines are drawn from the anterior laminar insertion (ALI) to the BMO reference plane. The distance between the two cross-points is measured as D. The two black solid lines are drawn parallel to the BMO reference plane at each ALI, and the black dotted line indicates the mean level of the ALI. This corresponds to the mean anterior laminar insertion depth (ALID). The area surrounded by the anterior LC surface, BMO reference plane, and the two vertical lines is measured as S. The mean LC depth (mLCD) is computed by dividing S by D. The LC curvature index is the difference between the mLCD and mean ALID. The schematic diagram is demonstrated in Fig 1C.
