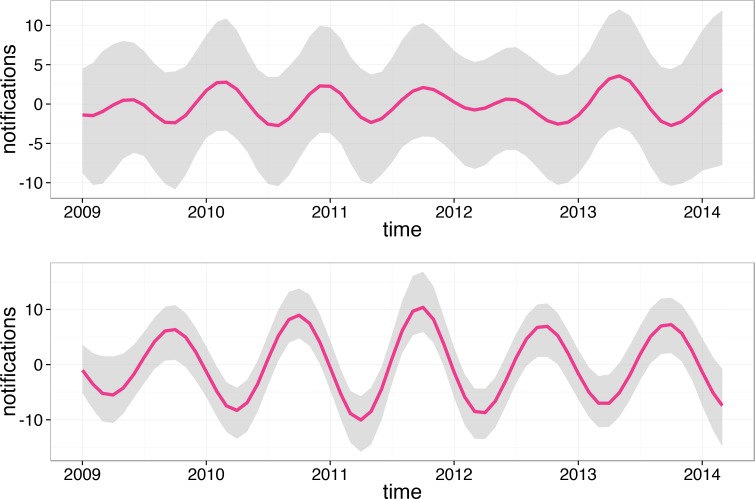
Fig 4. Seasonal component (mean over 10,000 iterations) for HZ (top) and varicella (bottom) in the entire resident Perth population.
The grey area is the 95% confidence interval (calculated based on 10,000 Markov chain Monte Carlo samples, see [20] for details). Note that the seasonal component is conventionally centred to fluctuate around zero.

