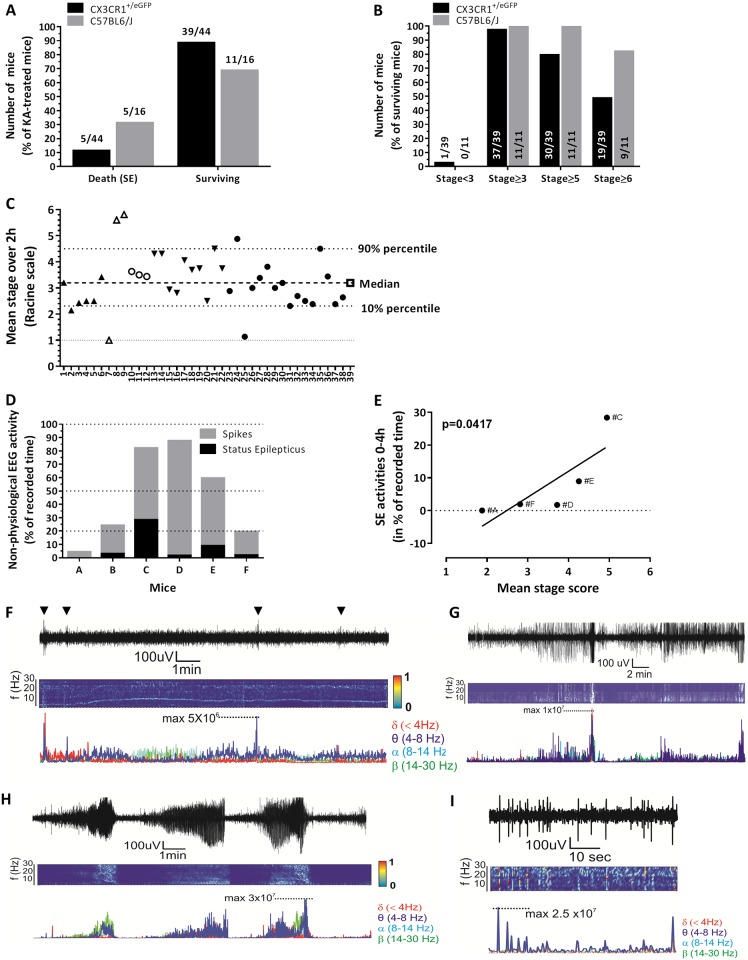
Fig 1. Behavioural and video-EEG read-outs after IN KA.
A) Mortality after SE induced by IN KA administration in C57BL6/J and C57BL6/J CX3CR1+/eGFP mice. B) Distribution of Racine scores in C57BL6/J and C57BL6/J CX3CR1+/eGFP mice. The majority of surviving mice reached stages 6 (>80% in C57BL6/J and ≈50% in C57BL6/J CX3CR1+/eGFP). Values indicate the number of mice at each Racine stage. C) Racine mean score over the 2 hours following IN KA. Identical symbols indicate mice assessed on the same day. D) Video-EEG was used to quantify duration of SE (black bars) and spike activity (grey bars) within the 4 hours following IN KA. E) Correlation between the Racine mean score and the time spent in EEG SE. (F-I) Examples of EEG recordings and analysis during baseline activity (F), status epilepticus (G-H) and spike activity (I). Time joint-frequency analysis and single frequency profile are also provided.

