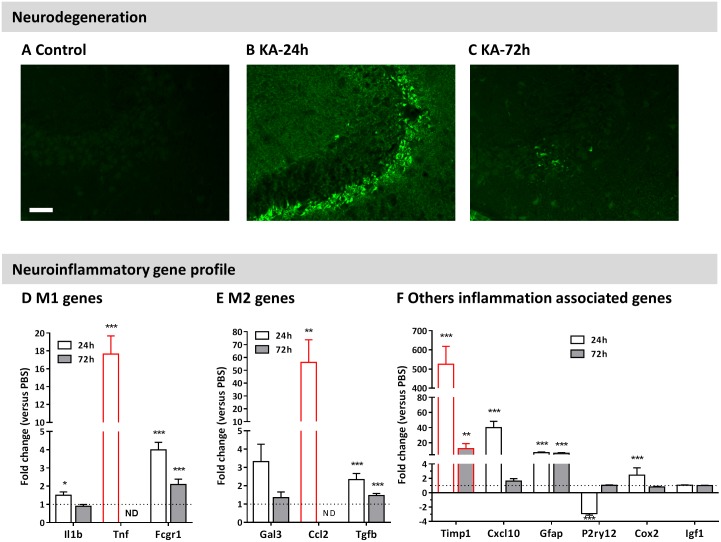
Fig 2. Neurodegeneration and neuroinflammatory gene profile after IN KA induced seizures.
A-C) Fluoro-Jade C staining is observed 24h after IN KA, diminishing at 72h. Correspondence existed between presence of FJC positive neurons and behavioral score after IN KA (B: Mouse 9, mean-score = 5.8; C: Mouse 28, mean-score = 3.8). Scale bar 50 μm. D-F) qPCR analysis and changes of inflammatory gene levels in mice experiencing stage 5 or higher. Analysis was performed 24h (white bars) and 72h (grey bars) after IN KA. Panels (D) and (E) represent mRNA changes for M1 and M2 microglial markers. Red bars indicate genes that are not detectable under control conditions (see materials and methods section). Results are presented as mean ± SEM (n ≥ 7 / group). Statistical analysis was performed using a non-parametric Mann-Whitney test between control and KA-treated conditions. *: p<0.05; ** p<0.01; ***: p<0.001 compared to controls.

