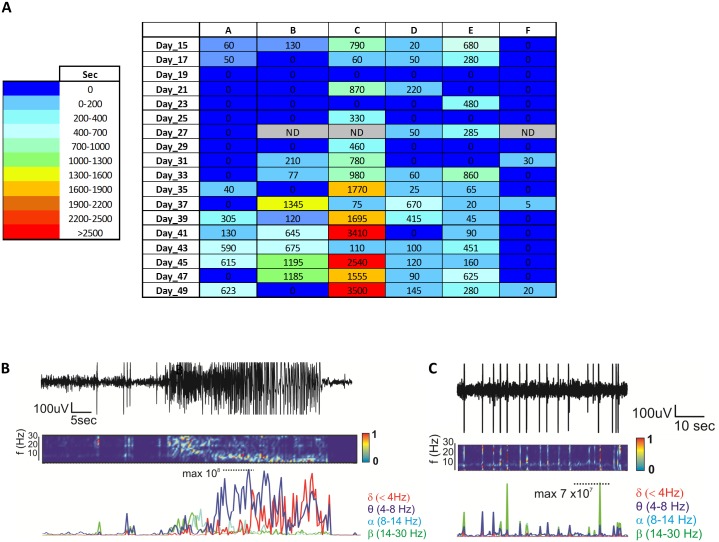
Fig 4. Video-EEG analysis during seizure progression.
A) Heat map (blue to red) and raw numbers indicate the sum of durations (in seconds) of spike activity recorded for each animal in the given recording session. B-C) Examples of EEG recordings during the chronic phase (e.g., SE in B and spike activity in C).

