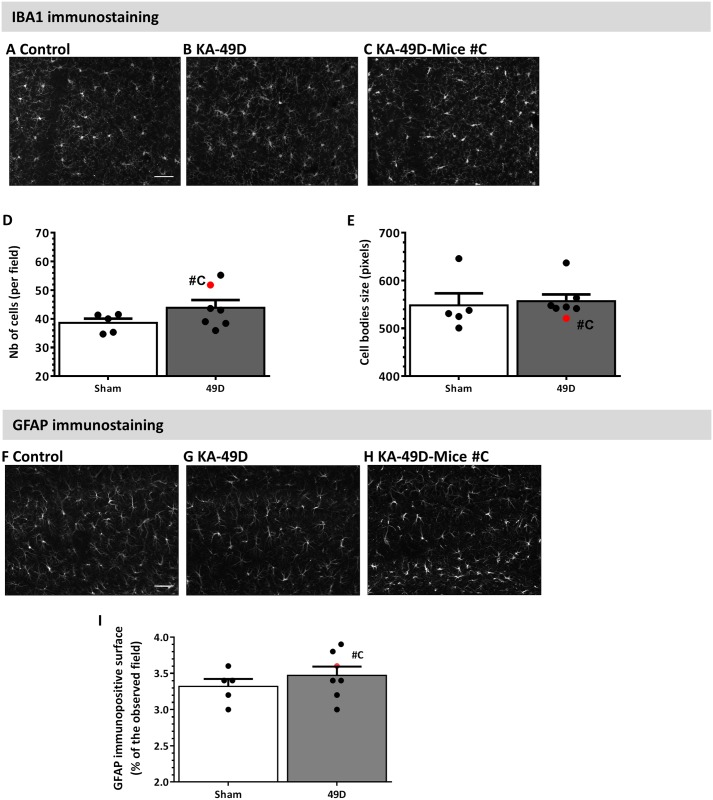
Fig 5. Lack of long-term microglia and astrocytes reactivity.
A-C) Representative images of IBA1 immunostaining in CA1 region in control implanted mice, IN KA mice and mouse #C (see below). Scale bar = 50 μm. D-E) IBA1 analysis shows no significant microglial activation in KA mice compared to control mice. Mouse #C experienced severe SE in and displayed elevated microglia density (red data in D). F-H) Representative images of GFAP immunostaining in control implanted mice, KA- mice and mouse C. Scale bar = 50 μm. I) Quantitative analysis of GFAP immunostaining in the hippocampus shows no difference at 49 days post KA. Results are presented as mean ± SEM. Statistical analyses were performed using a non-parametric Mann-Whitney test.

