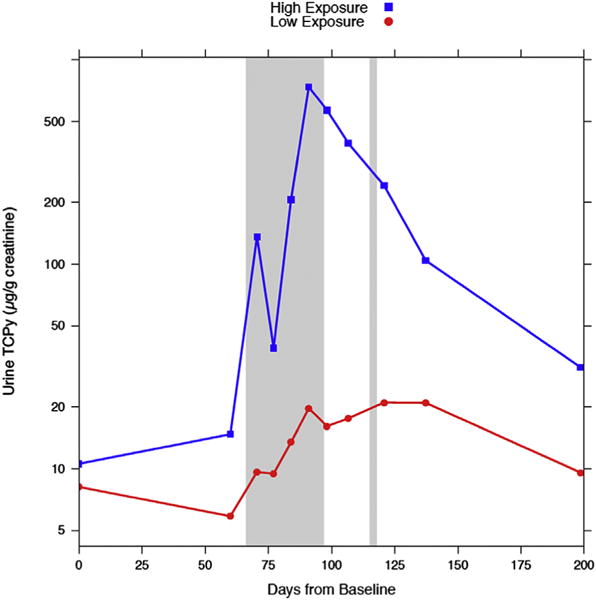
Fig. 1.

Median urine TCPy concentrations for the low and high exposure groups at baseline and the 10 intervals. There was no difference between the groups at baseline, all other time points showed a significant difference. The shaded area represents periods of chlorpyrifos application.
