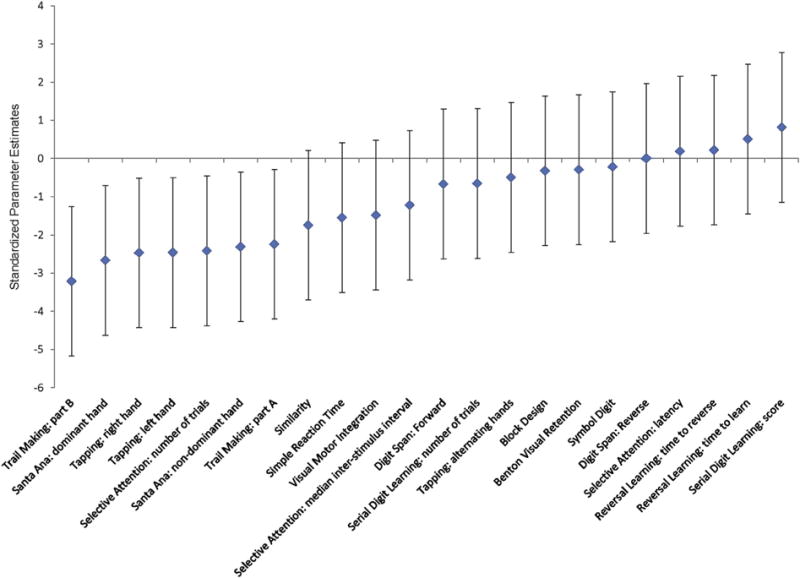
Fig. 2.

Standardized mean differences between high and low exposure groups on neurobehavioral outcome measures, controlled for field station and education. Negative differences correspond to poorer average performance among high exposed participants while positive differences indicate the opposite. The 95% confidence intervals for each estimated difference (solid vertical line) show the plausible range of the effect relative to zero.
