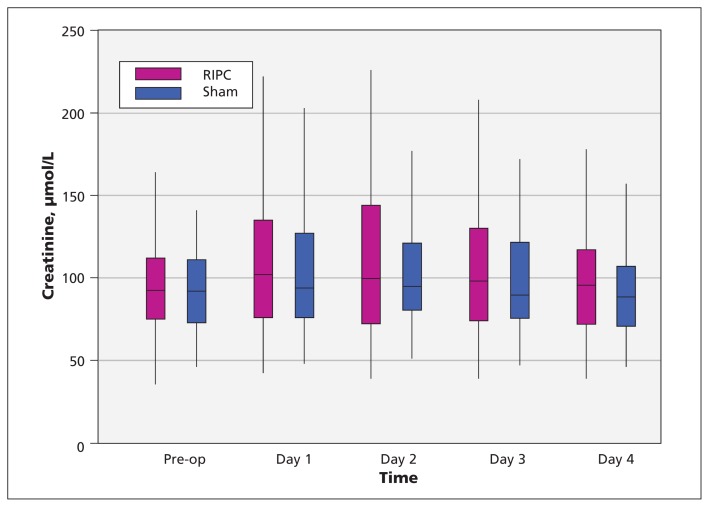
Figure 3:
Serum creatinine levels in the remote ischemic preconditioning (RIPC) and sham therapy groups. For each data point, the central horizontal bar represents the median, the box shows the interquartile range (25th to 75th percentile), and the lower and upper whiskers represent the 2.5th and 97.5th percentiles, respectively.

