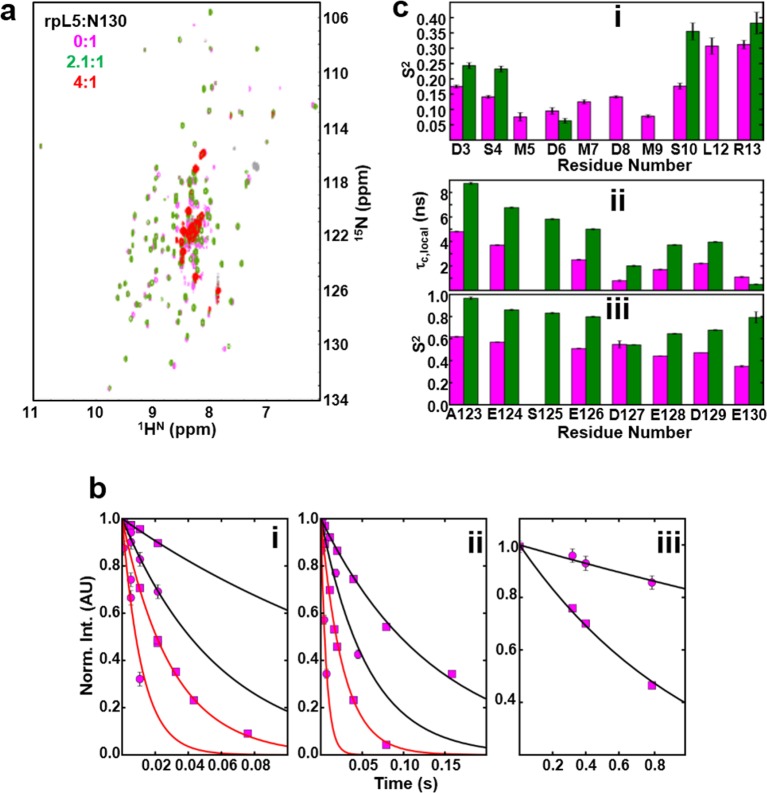
Figure 4. NMR chemical shift perturbations and amide backbone relaxation analysis of apo N130 and soluble complexes at 2.5:1 rpL5:N130 stoichiometry.
(a) 1H-15N TROSY-HSQC spectra of apo N130 (magenta), in a soluble complex with rpL5 (2.1:1 rpL5:N130; green) and in the phase separated state (4:1 rpL5:N130; red). (b) Examples of R2,β and R2,α peak intensity decay curves measured at 800 MHz (i) and 1000 MHz (ii), and R1 peak intensity decay curves measured at 800 MHz (iii) for free N130. In (i) and (ii), points and curves in black and red correspond to the R2,β and R2,α experiments, respectively. In (i)–(iii), circles and squares indicate data points for residues Tyr29 (within the folded pentamer core) and Glu121 (within the disordered A2 tract), respectively. Solid lines correspond to fits using a simple exponential decay model from which relaxation rates and intensities at zero time were extracted. (c) (i) Comparison of S2 values for the N-terminus for which data could be collected for apo N130 (magenta bars) and 2.5:1 rpL5:N130 (green bars). Comparison of c,local (ii) and S2 (iii) values for C-terminal residues in apo N130 (magenta bars) and 2.5:1 rpL5:N130 (green bars). S125 is overlapped in the apo N130 spectrum; therefore, under this condition, these analyses could not be performed.

