
Figure 5. The A2 tract extends away from the folded core of N130 on the pathway to phase separation.
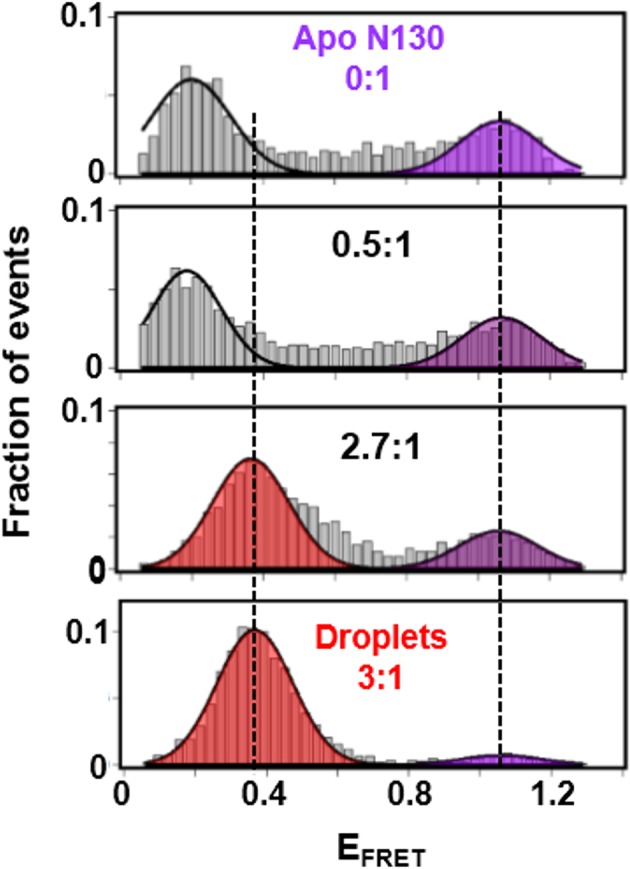
smFRET histograms for Alexa Fluor594/680-labeled N130Q15C/S125C (~100 pM; total [N130], 200 μM) at 0:1, 0.5:1, 2.7:1 and 3:1 (phase separated state) rpL5:N130 stoichiometry; the FRET events corresponding to conformational states with similar EFRET values are indicated by the shaded regions. The solid lines are Gaussian fits of the data, from which average EFRET values were determined.