Figure 1. Speech sounds evoke responses in the human motor cortex.
(a) Magnetic resonance image surface reconstruction of one representative subject’s cerebrum (subject 1: S1). Individual electrodes are plotted as dots, and the average cortical response magnitude (z-scored high gamma activity) when listening to CV syllables is signified by the color opacity. CS denotes the central sulcus; SF denotes the Sylvian fissure. (b) Acoustic waveform, spectrogram, single-trial cortical activity (raster), and mean cortical activity (high gamma z-score, with standard error) from two vSMC sites and one STG site when a subject is listening to /da/. Time points significantly above a pre-stimulus silence period (p<0.01, bootstrap resampled, FDR corrected, alpha < 0.005) are marked along the horizontal axis. The vertical dashed line indicates the onset of the syllable acoustics (t=0). (c) Same subject as in (a); distributed vSMC cortical activity when speaking CV syllables (mean high gamma z-score). (d) Total number of significantly active sites in all subjects during listening, speaking, and both conditions (p<0.01, t-test, responses compared to silence and speech). Electrode sites are broken down by their anatomical locations. S denotes superior vSMC sites; I denotes inferior vSMC sites.
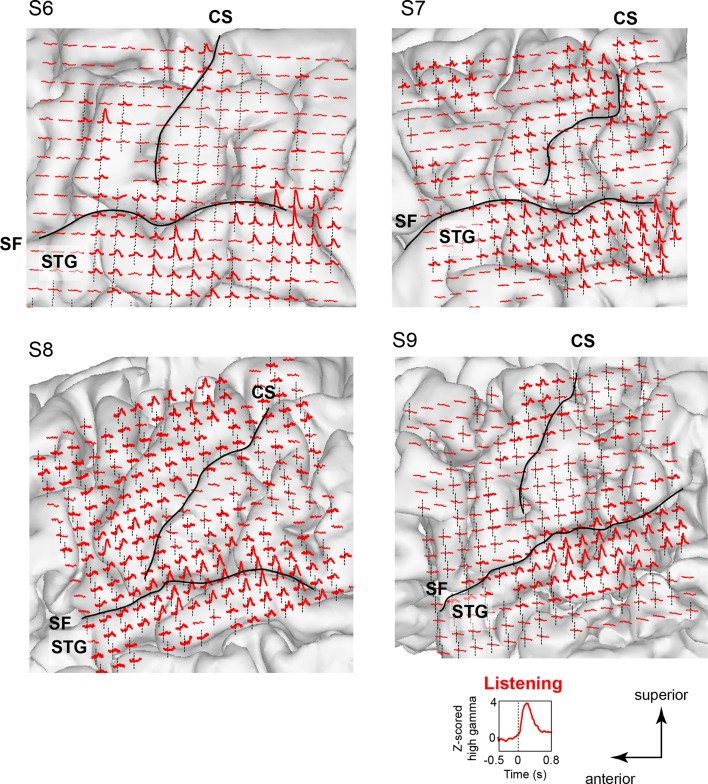
Figure 1—figure supplement 1. Average cortical responses to speaking and listening in all subjects (S2-S5).


