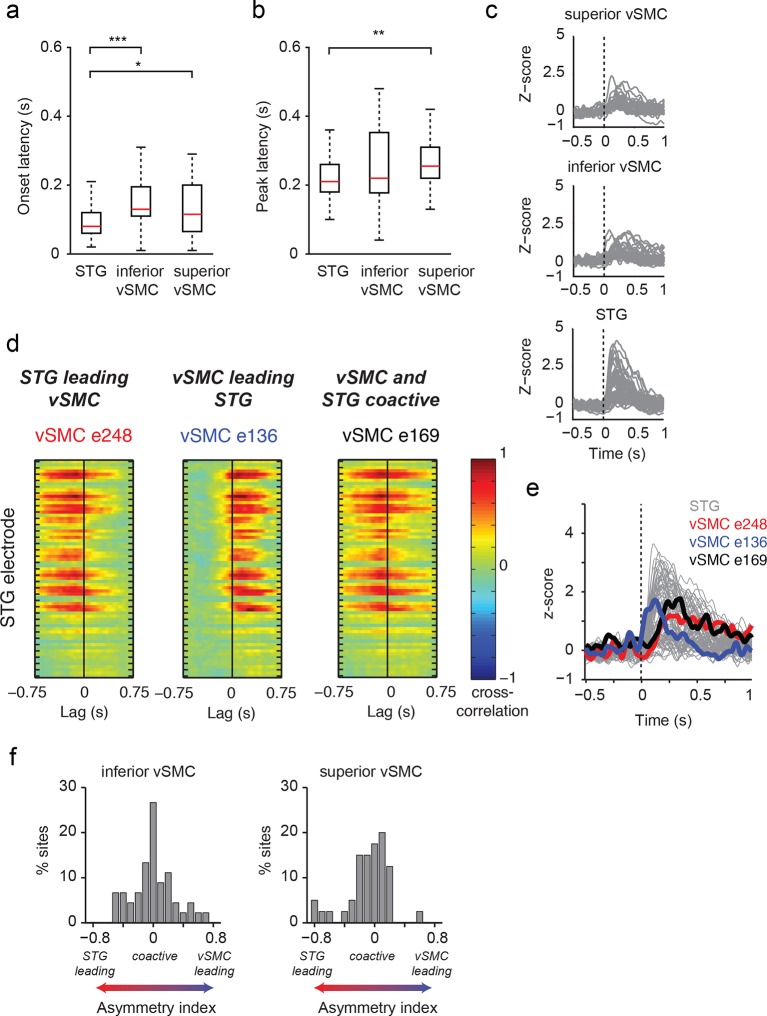
Figure 3. Dynamics of responses during CV listening in STG, inferior vSMC, and superior vSMC.
(a) STG onset latencies were significantly lower than both inferior vSMC (p<0.001, Z = −4.03) and superior vSMC (p<0.05, Z = −2.28). (b) STG peak latencies were significantly lower than superior vSMC (p<0.01, Z = −2.93), but not significantly different from peak latencies in inferior vSMC (p>0.1). In (a) and (b), red bar indicates the median, boxes indicate 25th and 75th percentile, and error bars indicate the range. Response latencies were pooled across all subjects. All p-values in (a) and (b) are from the Wilcoxon rank sum test. (c) Average evoked responses to all syllable tokens across sites in superior vSMC (n=32), inferior vSMC (n=37), and STG. Responses were aligned to the syllable acoustic onset (t=0). A random subset of STG responses (n=52 out of the 273 that were used in the latency analysis in (a) and (b)) are shown here for ease of viewing. (d) Example cross-correlations between three vSMC electrodes and all STG electrodes in one patient, for a maximum lag of ± 0.75 s. More power in the negative lags indicates a faster response in the STG compared to the vSMC electrode, and more power in the positive lags indicates a faster response in vSMC compared to STG. We observe vSMC electrodes that tend to respond later than STG (e248, left panel), vSMC electrodes that tend to respond before STG (e136, middle panel), and vSMC electrodes that respond at similar times to some STG electrodes (e169, right panel). (e) Average evoked responses during CV listening for all STG electrodes from this patient and the three vSMC electrodes shown in panel (d). Responses were aligned to the syllable acoustic onset (t=0), as in panel (c). (f) Percentage of sites with STG leading, coactive, or vSMC leading as expressed by the asymmetry index (see Materials and methods). Both inferior and superior vSMC show leading and lagging responses compared to STG, as well as populations of coactive pairs.

