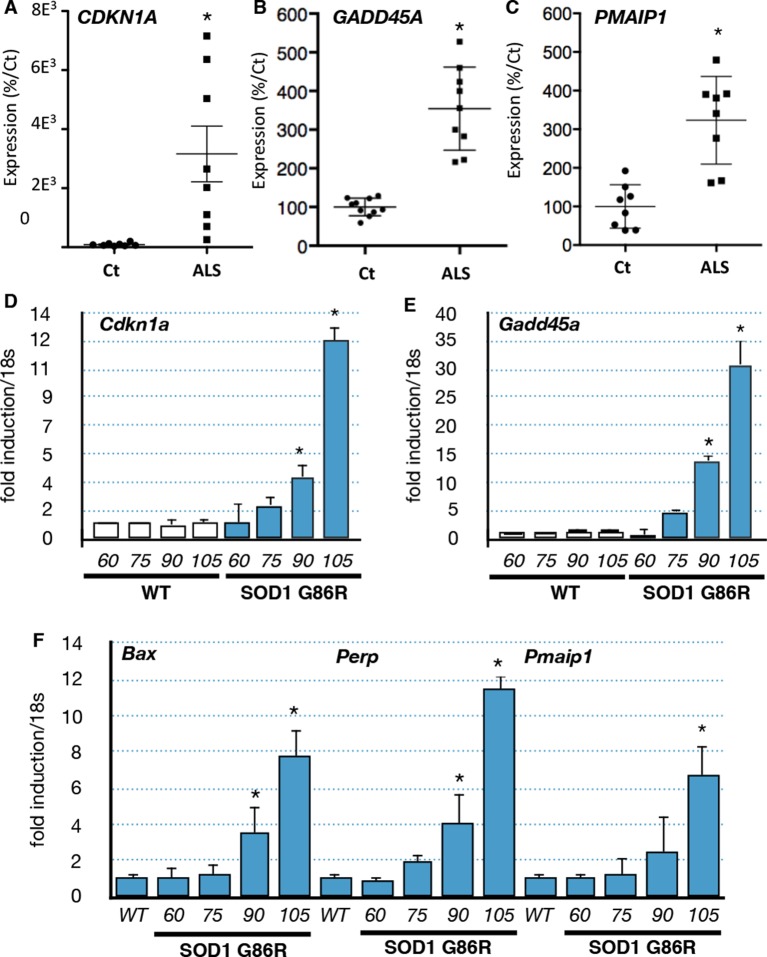
Figure 2. p53-family target gene expression in muscles from ALS patients and in an ALS mouse model correlates with disease intensity.
(A–C) RNA from muscle biopsies of control and ALS patients (n = 8, Neuromuscular Unit [BioBank of Skeletal Muscle, Nerve Tissue, DNA and cell lines]) was extracted and analyzed by RT-qPCR. Absolute levels are normalized against the average of the control group. (D–F) p53 family target genes mRNA levels were assayed in SOD1(G86R) mouse gastrocnemius muscle by RT-qPCR. Graphs are means of fold induction versus 60 days-old WT and of matching age (60, 75, 90, 105-days-old, n = 6) and experimental condition (wild-type, or SOD1(G86R)). *p<0.01 compared to control, as calculated by a one-way ANOVA test followed by a Tukey post-test.
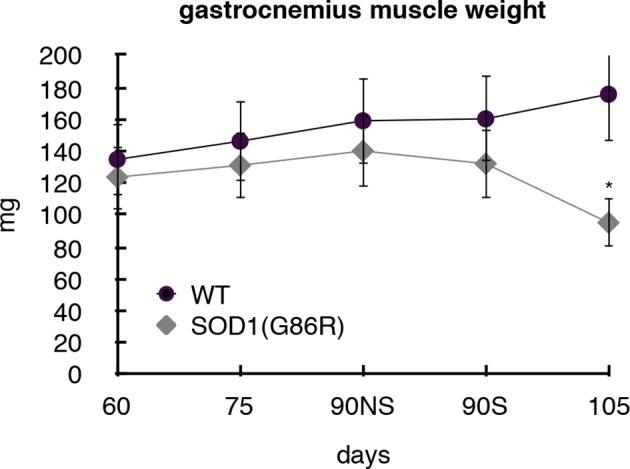
Figure 2—figure supplement 1. Gastrocnemius muscles from wild-type or symptomatic SOD1(G86R) (105 days) mice were dissected and weighted.


