. 2016 Feb 26;5:e10528. doi: 10.7554/eLife.10528

Figure 5. Expression of p63 and p53-family target genes following sciatic nerve crush, SOD1 expression of induction of stress.
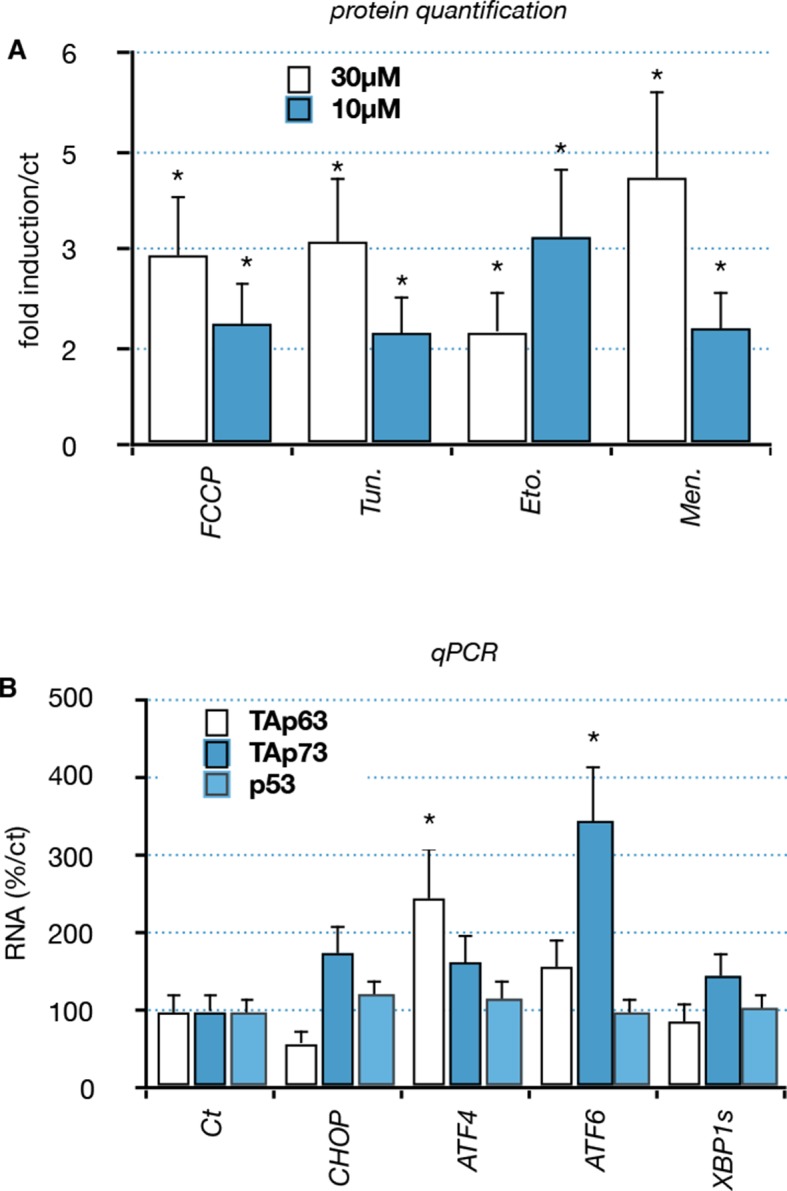
(AD) WT and SOD1(G86R) mice (80 days of age) were anesthetized and the sciatic nerve crushed. Sham-operated contra limbs served as control (Ct). After 7 days, expression of TA isoforms of Trp63 (A, TAp63), ∆N isoforms of Trp63 (B, ∆Np63), Gadd45a (C) and Cdkn1a (D) was assayed by RT-qPCR (n = 6). Values were normalized to the value of sham-operated WT muscles/animals. Bars represent means (relative induction versus Ct) with standard deviation (n = 3). *p<0.01 as calculated by a one-way ANOVA test followed by a Tukey post-test. (E) C2C12 myoblasts were transfected with expression vectors for SOD1 variants (WT or G86R). mRNA from SOD1 transfected cells were analyzed by RT-qPCR for p63 and p63 target gene expression. Bars represent means (relative induction versus Ct) with standard deviation (n = 3). *p<0.01 as calculated by a one-way ANOVA test followed by a Tukey post-test. (F) Proteins were extracted from C2C12 myoblasts treated with compounds: FCCP, Tunicamycin (Tun), Etoposide (Eto), menadione (Men). Western blot analysis revealed TAp63 expression.

DOI: http://dx.doi.org/10.7554/eLife.10528.014

Figure 5.

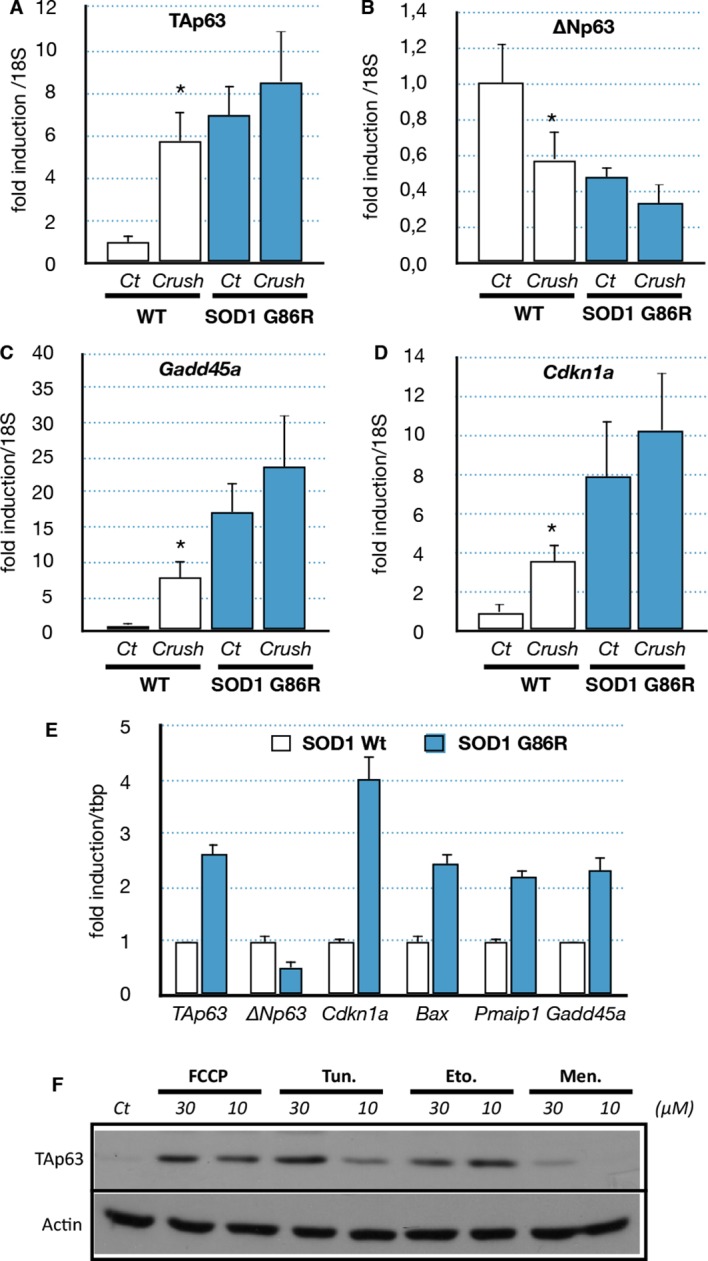
Figure 5—figure supplement 1. Regulation of p63 and Mdm2 expression by SOD1 (G86R).

Figure 5—figure supplement 1.

(A) Protein were extracted from C2C12 myoblasts expressing WT or SOD1(G86R) after 5-days puromycin selection. Western blot analysis revealed TAp63, Bax or SOD1 expression. Actin was used as loading control. (B, C) C2C12 myoblasts were transfected with expression vectors for SOD1 variants (WT or G86R) or TAp63γ (2 concentrations, 1, 2) and luciferase reporter genes containing deletions of the promoter of the ΔN isoforms of P63 (-1584-+32 or -46/+32) or Mdm2 promoter. Bars represent means (relative induction versus Ct) with standard deviation (n = 3). Results are standardized with the 'minimal' promoter reporter gene -46/+32-luc. Ct = cells transfected with an empty vector. Bars represent means (relative induction versus Ct) with standard deviation (n = 3). *p<0.01.
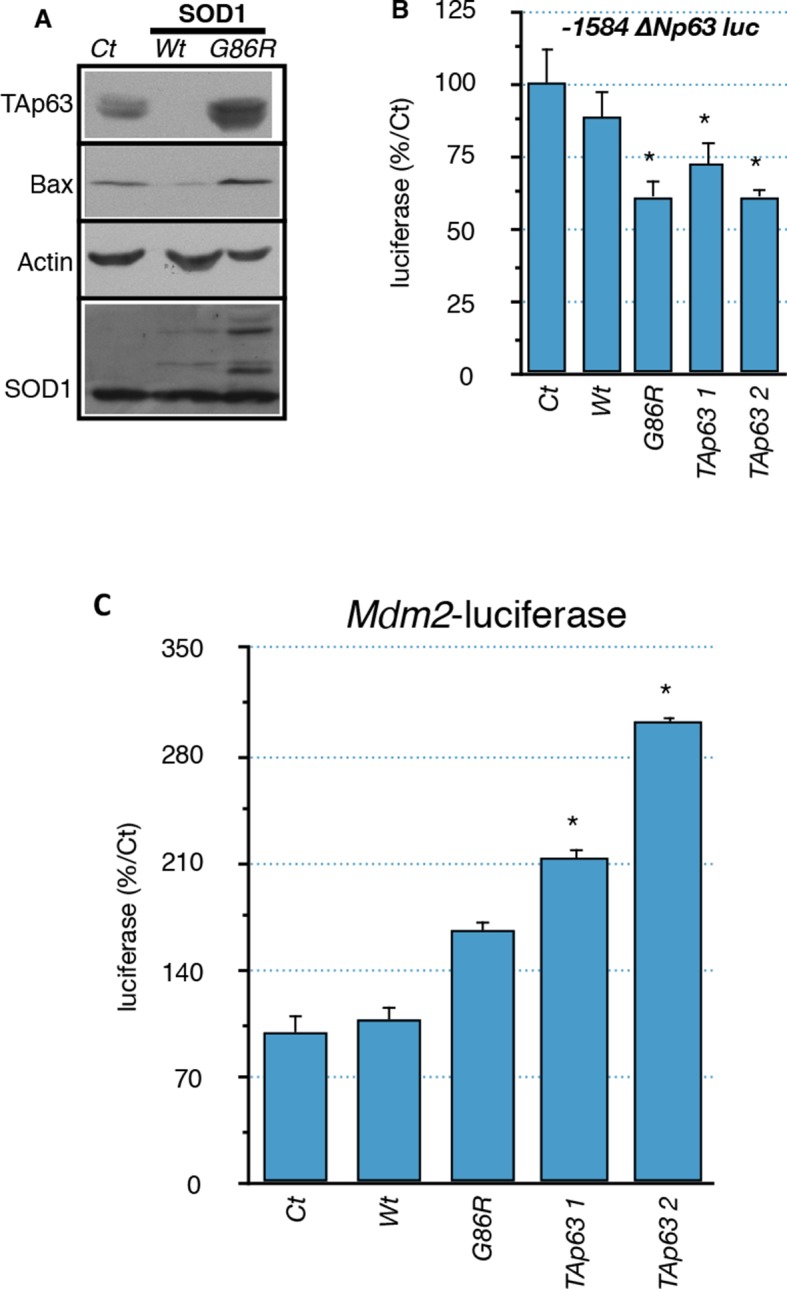
Figure 5—figure supplement 2. Functional interaction between members of the p53 family and ER or mitochondrial stress.

Figure 5—figure supplement 2.

(A) Quantification: Proteins were extracted from C2C12 myoblasts treated with compounds: FCCP, Tunicamycin (Tun), Etoposide (Eto), menadione (Men). Western blot analysis revealed TAp63 expression. Bars correspond to means with SD (n = 3). *p<0.01. (B) C2C12 myoblasts were transfected with expression vectors encoding transcription factors involved in the ER or mitochondrial stress pathway (CHOP, ATF6, ATF4, XBP1s). RNA levels for TA isoforms of Trp63, TA isoforms of P73 and P53 were followed by RT-qPCR. Bars represent means (relative induction versus Ct) with standard deviation (n = 3).*p<0.01.