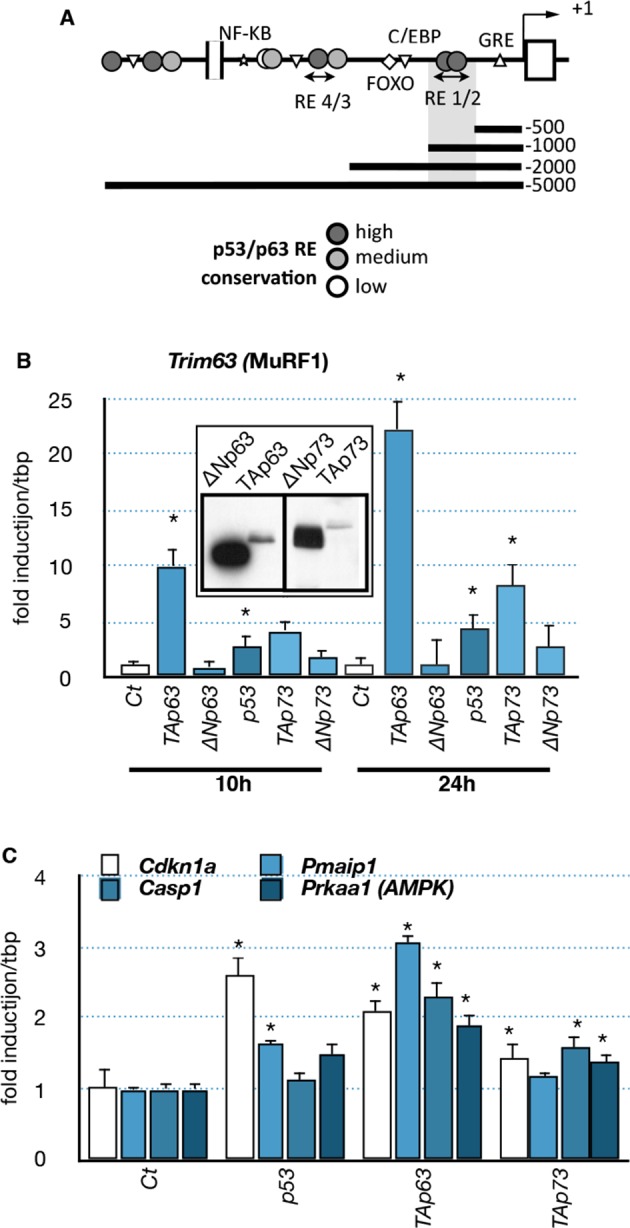
Figure 6. Effects of p53-family expression on Trim63 and p53-family target genes.

(A) Schematic representation of the Trim63 promoter indicating the location of putative p53/p63 binding sites. (B, C) C2C12 myoblasts were transfected (inserted panel: western blot) with various p53-family members (TAp63γ, ΔNp63γ, p53, TAp73β, ΔNp73β). Total C2C12 RNA was subjected to RT-qPCR after 10 hr or 24 hr of transfection and Trim63 (B) or p63 target (C, Cdkn1a, Pmaip1, Casp1, Prkaa1) expressions are shown relative to control-transfected cells. Bars are means of fold induction versus the control (Ct) with SD (n=3). *p<0.01 as calculated by a one-way ANOVA test followed by a Tukey post-test.
