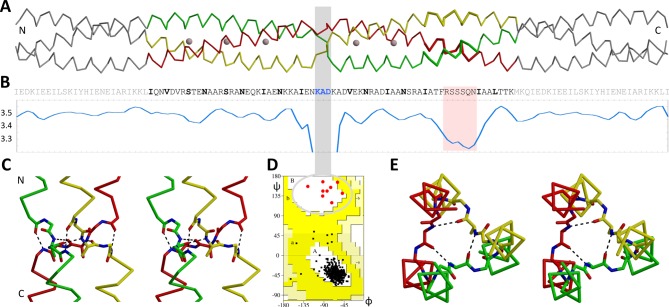
Figure 2. The β-layer in the Actionobacillus OMP100 stalk.
(A) The structure of the Actinobacillus OMP100 stalk construct is aligned with (B) its sequence and a periodicity plot. The area of the stammer is highlighted in pink, the three residues of the β-layer by a grey bar. This bar points to the β region of the Ramachandran plot (D), where all nine β-layer residues of the trimer are found. The close-ups show the (C) side and (E) top view in stereo, highlighting the β-layer interactions. The trimer is colored by chain, GCN4 adaptors in grey. The plot is smoothed over a window of three residues to mask local fluctuations. Empty regions of the Ramachandran plot are cropped.

