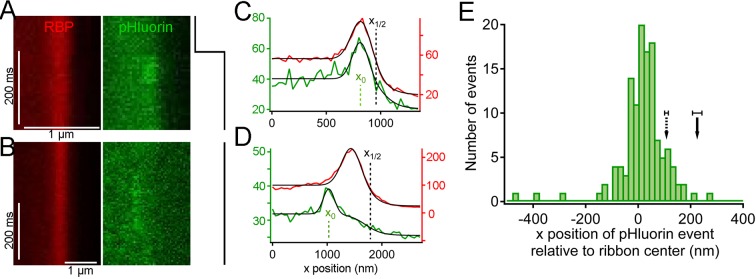
Figure 5. Synaptic vesicle exocytosis reported by pHluorin occurs at a distance from the plasma membrane.
(A) Example of x-t images showing a pHluorin event from SypHy (green) at a ribbon shortly after onset of depolarization from -60 mV to -15 mV, shown by the trace to the right. Ribbon fluorescence from deep-red CF633-RBP is pseudocolored red. (B) Example of x-t images showing a pHluorin event from SypHy (green) on the membrane-distal side of a ribbon (red) in a different cell during depolarization to -15 mV. (C) (D) Fluorescence intensity profiles along the x-axis for RBP (red) and pHluorin (green) for the examples shown in A and B. Black lines are fits as described in Figure 3A–D and in Materials and methods. The x-axis position of the pHluorin event was taken to be the peak of the Gaussian from the fit (x0, shown by the dotted green line), and the position of the plasma membrane was taken to be the parameter x1/2 (dotted black line) from the fit to the fluorescence profile of the ribbon (red traces). (E) Histogram of the x-axis position of 127 pHluorin events from SypHy and Vglut1-pHluorin during sustained depolarization. The solid arrow shows the average relative position of the plasma membrane, estimated as described in Materials and methods (error bar: ± 1 sem). The dashed arrow shows the estimated position of the membrane at the top and bottom of the optical section, arrived at by assuming that membrane curvature observed along the y-axis for each x-y image also applied in the z-axis. Most of the pHluorin events fell outside the range of membrane positions between the two arrows.
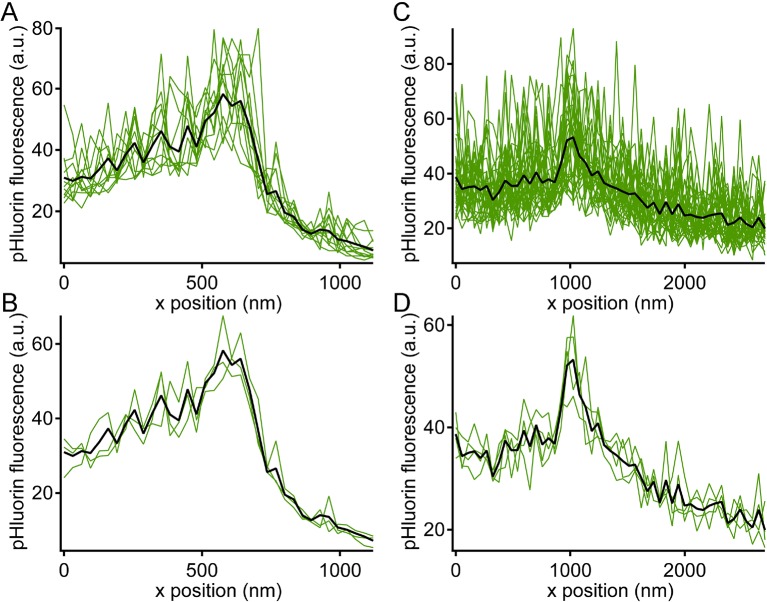
Figure 5—figure supplement 1. Noise level during pHluorin events.
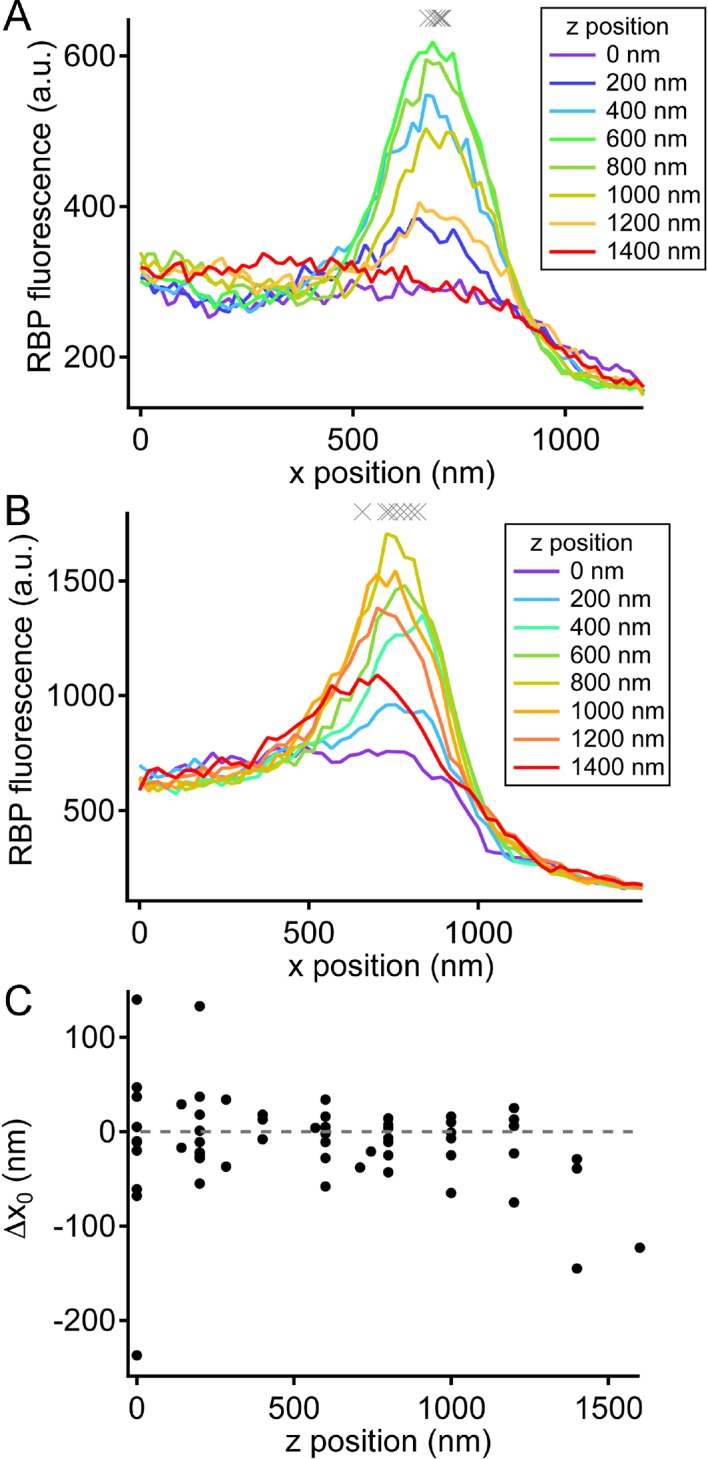
Figure 5—figure supplement 2. Variation in ribbon position in different focal planes.


