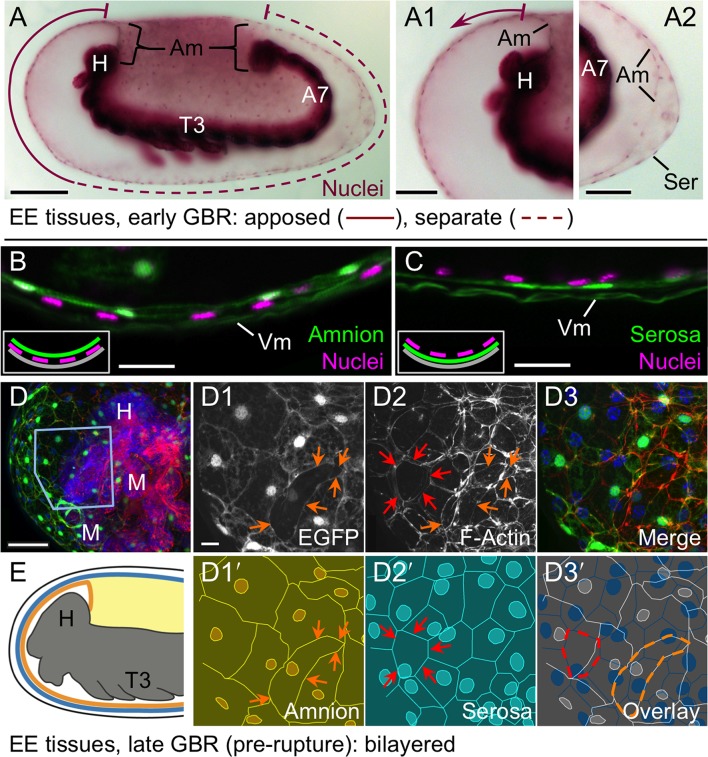
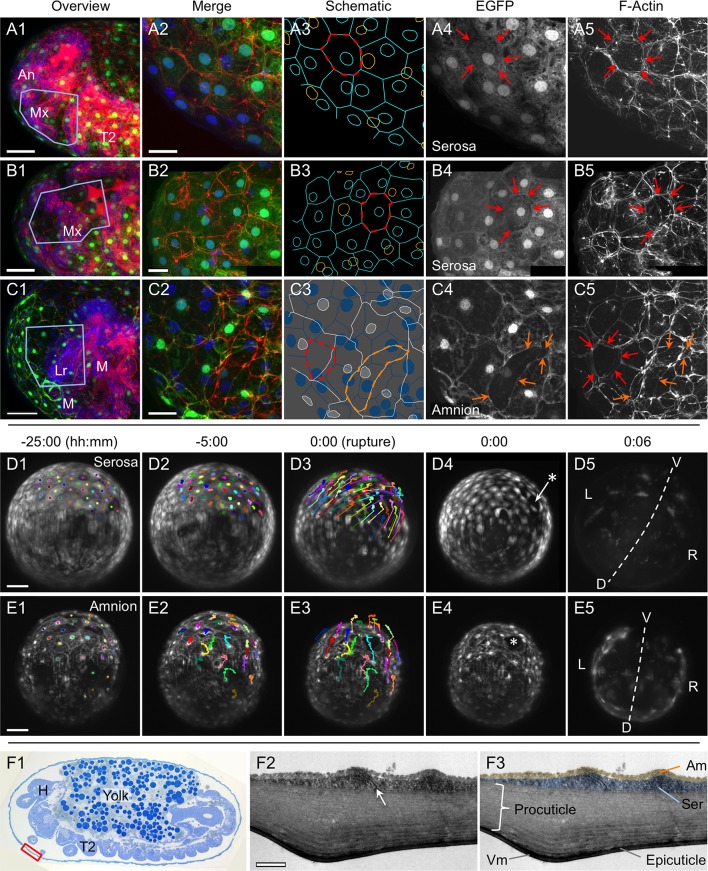
Although EGFP intensity varies between cells, EGFP signal for a single EE tissue type labels all cells within a continuous epithelial sheet. Moreover, the amnion and serosa have strikingly different cellular morphologies, enabling cells of both tissues to be distinguished, with the serosa overlying the amnion. (
A–C) Both EE tissues can be discerned as continuous epithelia within the rupture competence zone (shown after the completion of germband retraction, at 44–48 hr after egg lay). Shown are two examples with serosal EGFP (
A–B) and one with amniotic EGFP (
C, reproduced from main text
Figure 2D, for comparison). 'Overview' images show lateral, ventral, and ventral-lateral views of maximum intensity projections (
A1,
B1,
C1, respectively) with anterior left and the region of interest around the head appendages indicated by the blue boxed region (due to the curvature of the egg, only the regions actually visible in high-magnification projections of thinner z-stacks are indicated). 'Merge' images (
A2,
B2,
C2) show maximum intensity projections of the indicated region, labeled for F-Actin (red, phalloidin), nuclei (blue, DAPI), and the specified EE tissue (green, EGFP). Note that embryonic-specific signal (F-Actin and DAPI signal for small cells not in contact with the tissue at the egg surface) was manually deleted from deeper optical sections with the freehand selection tool in ImageJ before rendering the projected images shown here. 'Schematic' images (
A3,
B3,
C3) show cell and nuclear outlines. Cell outlines were determined by EGFP signal (for
A3,
B3,
C3) and F-Actin signal (for
C3, for serosal outlines only). Nuclear outlines were determined by EGFP signal or DAPI (for all EGFP-negative nuclei only). Serosal cells are shown in cyan or blue; amniotic nuclei and cells are shown in orange or white. Dashed outlines highlight individual serosal (red) and amniotic (orange) cells, which are also labeled by arrows of the same color in the single-channel micrographs for EGFP (
A4,
B4,
C4) and F-Actin (
A5,
B5,
C5). Strong F-Actin signal correlates with serosal cell shape (compare
A4,
A5 and
B4,
B5), such that F-Actin signal can be used to infer serosal cell shape even when that tissue is not labeled with EGFP (
C3,
C5). Furthermore, the F-Actin-inferred serosal cell outlines correspond to EGFP-negative nuclei in the amnion enhancer trap line (
C3). Note that in order to preserve anterior-ventral EE tissue structure and topography, the specimens presented here (
A–C) are still within the vitelline membrane. After fixation, embryos were cut in half (transversely) with a razor blade to allow the phalloidin and DAPI staining reagents to penetrate into the sample. (The EGFP is the endogenous signal.) (
D–E). For over a day prior to rupture, no cell mixing or change in cell number occurs in either the serosa (
D) or the amnion (
E). Selected stills from time-lapse movies are shown at the times indicated relative to rupture (at 30°C, z-stacks acquired every 2 min), in anterior aspect and oriented with the ventral region uppermost, with light sheet illumination coming from above. Individual nuclei were tracked hourly (uniquely colored tracks), showing the static nature of serosal cells until the time of rupture, while amniotic nuclei move much more within the cells and the amniotic tissue itself shifts slightly anterior-dorsally. The initial opening at the time of rupture is indicated with an asterisk (
D4,
E4). Axes were determined based on weak embryonic signal (
D5,
E5; the withdrawing edge of the amnion is still visible in
E5). Images shown here are maximum intensity projections with gamma corrections 0.5 (serosa) and 0.7 (amnion) as well as brightness correction to accommodate for changes in signal intensity of these lines during development (see
Figure 1—figure supplement 1 and
Koelzer et al., 2014). For these specimens, cellular details at the time of rupture are shown in main text
Figure 4D–E. Acquisition details are specified in
Supplementary file 1. (
F) The bilayer arrangement of the amnion and serosa can also be seen in transmission electron micrographs of sagittal sections (examined after the completion of germband retraction, at 44–48 hr after egg lay; see also main text
Figure 2B–C). The red box on the semithin section (1 µm thick, stained with toluidine blue) approximately indicates the anterior-ventral region shown in
F2–F3. The arrow highlights an intercellular junction within the serosa (
F2), and false coloring highlights the continuity of the two distinct epithelial layers (
F3). Both EE tissues have very flat cells, with an apical-basal thickness of only ~200 nm in the amnion and ~450 nm in the serosa, in the aponuclear region shown here. Ultrathin sections (50–100 nm thick) were cut with an 'Ultra' diamond knife on a Leica Ultracut UCT microtome, and examined with a Zeiss EM 109 electron microscope. Scale bars are 50 µm (
A1,
B1,
C1,
D1–D5,
E1–E5), 20 µm (
A2–A5,
B2–B5,
C2–C5), and 1 µm (
F2–F3). Abbreviations: An, antenna; Am, amnion; D, dorsal; H, head; L, left; Lr, labrum; M, mandible; Mx, maxilla; R, right; Ser, serosa; T2, second thoracic segment; V, ventral; Vm, vitelline membrane.


