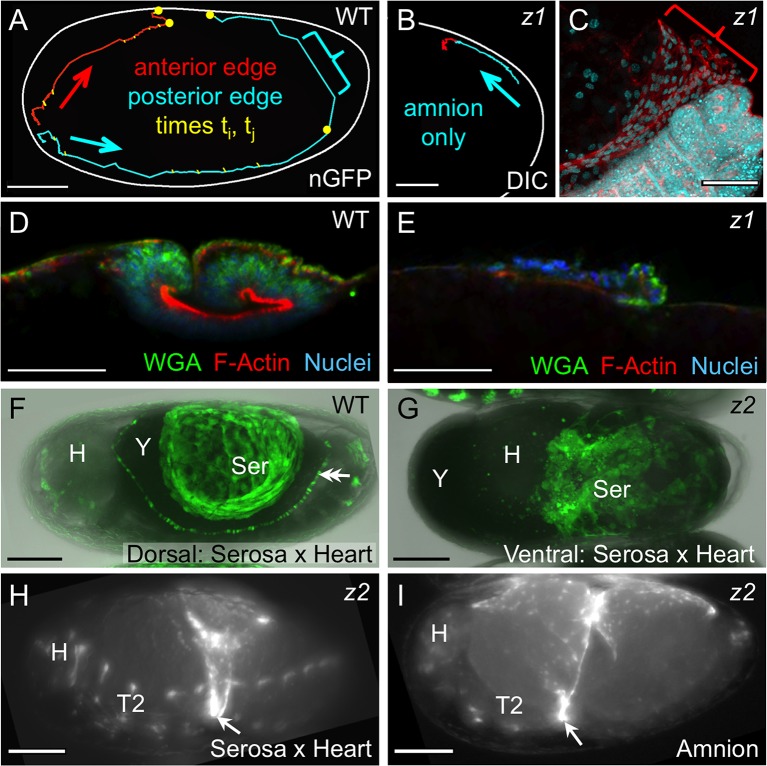
Figure 5. Withdrawal dynamics: serosa-driven progression.
Images are lateral (A–E,H), dorsal-lateral (F,I) or ventral (G), with anterior left and dorsal up, shown as sagittal optical sections (A–B,D–E) or maximum intensity projections (C,F–I). (A−E) Tracking and histological staining of withdrawing EE tissue edges. The WT EE tissue edge squeezes, then rapidly clears, the abdomen. In A, the blue bracket marks a 1-minute interval within a 6.7-hr total interval for the entire red/anterior and cyan/posterior tracks, at 21°C. The distance of the bracketed track segment from the vitelline membrane (white outline) reflects the degree of squeezing of the abdomen. After Tc-zen1RNAi (z1), an amnion-only posterior edge contracts slowly over an uncompressed abdomen. In B, the entire track represents a 3.9-hr interval at 21°C. Note that the track is close to the vitelline membrane outline. Slow amnion-only progression is in part due to ruffling of the tissue. The red track segment in B corresponds to the period of tissue ruffling shown morphologically in the region of the red bracket in C (same staining reagents as in D). Furthermore, there is no apical F-actin enrichment in the folding tissue (E, compare with D and Figure 3E–F). (F–G) While WT serosal contraction leads to a dorsally condensed tissue (F), in strong Tc-zen2RNAi (z2) phenotypes, the serosa condenses ventrally over the unopened amnion and the confined embryo (G). The double arrowhead labels the cardioblasts; 'Y' marks the opaque yolk. (H–I) In weaker Tc-zen2RNAi (z2) phenotypes the EE tissues can rupture and tear ectopically, leaving a 'belt' of EE tissue that squeezes the embryo (arrows). Scale bars are 100 µm (A,F–I) and 50 µm (B–E). Abbreviations as in previous figures.

