. 2016 Feb 15;5:e12959. doi: 10.7554/eLife.12959

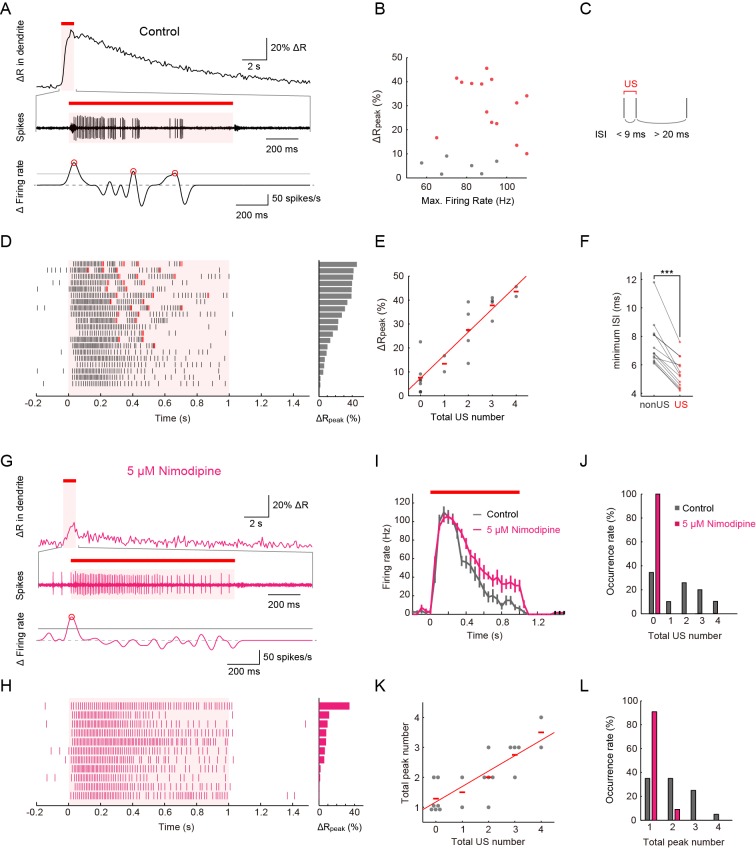
Figure 3. Simultaneous recordings of firing responses and dendritic Ca2+ transients in fillet preparations of larvae upon noxious thermal stimulation.

Data obtained from fillet preparations of control larvae (AF), those from L-type VGCC-blocked larva (G and H), and their comparisons (IL). In each trial, 40-mW IR laser was focused onto a proximal dendritic branch for 1 s (indicated by red bars above traces, and magenta shadings in (A, D, G, I and H) and the Ca2+ transient was detected from a ROI that was set on a distal branch 100 μm away from the focus of the IR-laser beam. (A and G) Representative recordings of a control larva (A) and a larva treated with 5 μM Nimodipine (G). Dendritic Ca2+ fluctuations for 20 s (top) and an enlarged trace of an extracellular recording for 1.675 s including the 1 s duration of the IR-laser irradiation (middle). The time derivative of firing rate fluctuation based on the spike density estimation with the Gaussian kernel (σ = 25 ms) and the normalized threshold settings (bottom). The peak of firing rate fluctuation is defined as in the text and marked with red circles. (B) Peak amplitudes of Ca2+ transients are plotted against maximum firing rates (defined in Materials and methods). ΔRpeak is defined as the averaged ratio of 400–700 ms after the cessation of IR-laser stimulation, which is employed as a representative value of each trial. See also the legend of D. A significant correlation was not observed (p > 0.46, ρ = 0.17; Spearman's rank correlation test; n = 20 cells). (C) The definition of 'unconventional spikes' (US). Signatures of US were extracted according to the following two conditions: (1) the first interspike interval (ISI) of three sequential spikes was less than 9 ms, and (2) the second ISI was longer than 20 ms. Then, a pair of the first and second spikes within each sorted triplet was designated as 'US'. (D and H) Raster plots of firing (left) and magnitudes of ΔRpeak (right). (D) All trials in panel (B), where control larvae were used, are sorted in a descending order of magnitude of ΔRpeak (right gray bars). Red raster lines indicate US. Six trials that elicited no US are labeled by gray color in B. (H) When fillet preparations were treated with 5 μM Nimodipine, none of the 11 trials elicited US during IR irradiation. (E) Amplitudes of ΔRpeak are plotted against total US numbers for each trial. Short horizontal red bars indicate the averages of ΔRpeak, and the red line is a linear regression of plotted data (p < 1.9 × 10⁻⁸, ρ = 0.91; Spearman’s rank correlation test; n = 20 cells). Our original definition of US in fact displayed a suboptimal correlation to the peak amplitude. We redefined USs using different parameter sets (lengths of the first and second interspike intervals) and calculated Spearman’s correlation coefficients to estimate how well the total US number is correlated with the peak amplitude. As a result, our original definition in C in fact displayed a suboptimal correlation to the peak amplitude (data not shown). (F) Comparative analysis of ISI between US and between non-US events. For trials with at least one US, the minimum length of ISI between US in each trial was compared to that between non-US (p < 5.2 × 10⁻⁶; paired t-test; n = 13 cells). (IL) Temporal patterns of firing rates (I) and histograms of the total US number (J) or the total peak number (L) in control and Nimodipine-treated larva (gray and magenta, respectively). See also the legend of A. (K) A plot of total peak numbers versus total US numbers for each trial in the control. Data in I are presented as mean ± s.e.m.

DOI: http://dx.doi.org/10.7554/eLife.12959.014

Figure 3.

Figure 3—figure supplement 1. Simultaneous recordings of firing responses and dendritic Ca2+ transients in fillet preparations of larvae upon noxious thermal stimulation.

Figure 3—figure supplement 1.

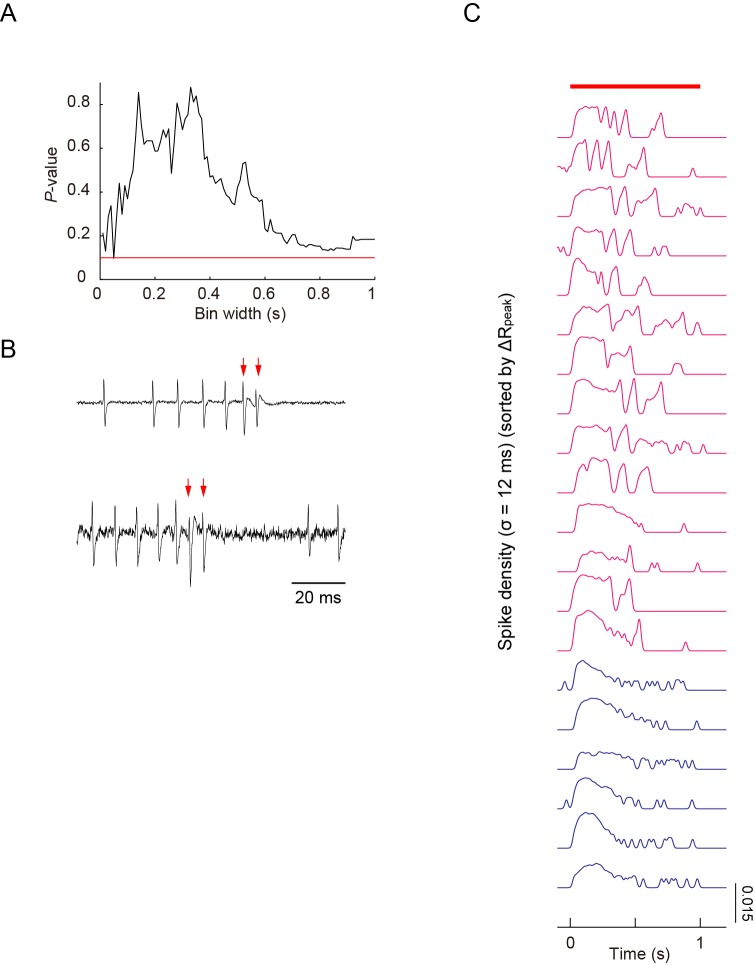
(A) As shown in Figure 3B, peak amplitudes of Ca2+ transients did not display a strong correlation with maximum firing rates, which were defined by one window size (the sliding window/∆t = 400 ms), when 40-mW IR-laser irradiation was given to proximal dendrites. We increased ∆t between 10 ms and 1000 ms in steps of 10 ms; and showed that there were no statistically significant correlations between the estimated maximum firing rates and the peak amplitudes of Ca2+ transients (Spearman rank correlation test). The red line indicates p = 0.1. (B) In two out of 20 datasets, extracellular displayed irregular waveforms representing the fluctuation of membrane conductance during the US, suggesting the presence of the excitatory currents. The red arrows indicate the spikes identified as the components of US. This low success rate of detecting the irregular waveform was possibly due to the spatially restricted membrane area of the soma where the recording electrode can detect the minute change of cellular conductance. We hypothesized that these differential patterns may encode command signals and that those signals should be transmitted to and decoded by target neuron(s) (see 'Discussion'). (C) The spike density representation of the firing patterns, which are indicated by raster plots in Figure 3D. Traces of spike densities were estimated using a Gaussian filter kernel with σ = 12 ms. All traces are sorted in descending order of magnitude of ΔRpeak. The magenta traces indicate that the amplitudes of ΔRpeak are greater than 10%; the blue traces indicate those below the threshold. The red bar above the traces represents the timing of IR-laser irradiation. Genotype: 3×[ppk-TNXXL] (attP2)/ 3×[ppk-TNXXL] (attP2).
Figure 3—figure supplement 2. Simultaneous recordings of firing responses and dendritic Ca2+ transients in fillet preparations of larvae expressing the lowest-threshold form of dTrpA1.

Figure 3—figure supplement 2.

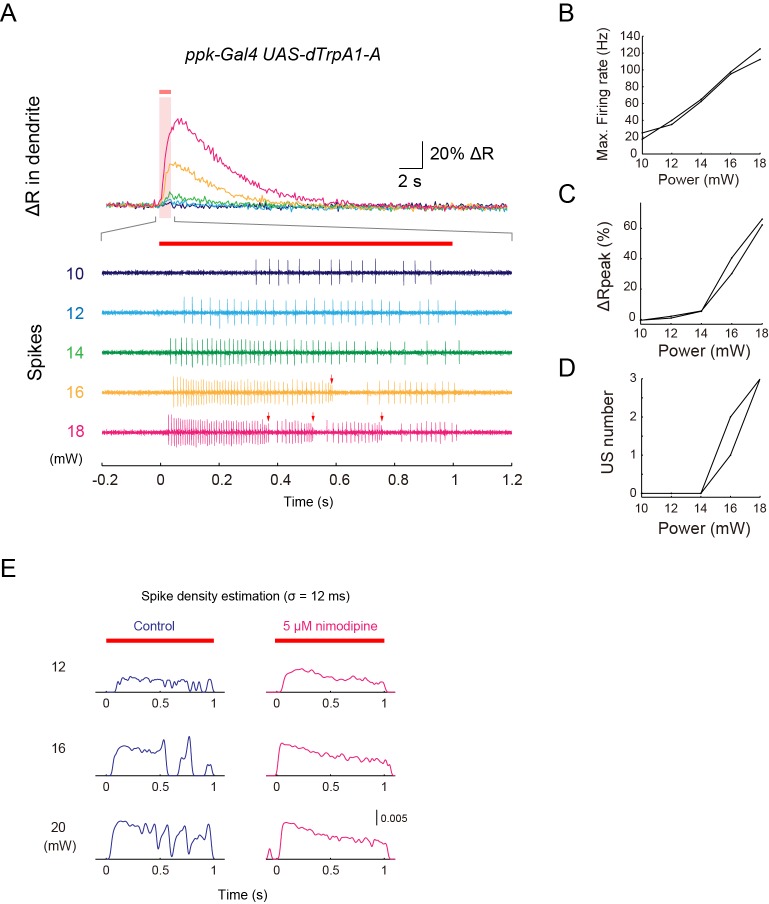
(AD) Simultaneous recordings of dendritic Ca2+ transients and firing responses that were obtained from a single dTrpA1-A-expressing Class IV neuron. One second IR-laser irradiation (red bars above traces in A) was targeted to the proximal dendritic arbors, and the output power was raised from 10 to 18 mW in steps of 2 mW. (A) Dendritic Ca2+fluctuations (top) and an enlarged trace of extracellular recording for 1.4 s (from –0.2 to 1.2 s) including the duration of IR-laser irradiation (bottom). Colors represent trials at the indicated power settings (e.g. the green traces are from the same trials with 14-mW IR-laser power). The red arrows indicate the occurrences of US. The following three measurements of two neurons are plotted in (BD): the maximum firing rates (Max. Firing Rate [Hz]; B), the peak amplitudes of ΔRRpeak [%]; C), and the number of occurrences of US (US number; D). The firing rate was almost linearly correlated to the laser power (B); on the other hand, the peak amplitude of the Ca2+ transient and the number of accompanied USs abruptly rose at power settings above 14 mW (n = 3 cells; C and D). These occurrences of both the 'burst and pause' firing pattern and the Ca2+ transient above a certain threshold in the TrpA1-A+ neurons is comparable to the responses of the wild-type neurons (compare Figure 3—figure supplement 2A with Figure 1D, and Figure 3—figure supplement 2B with Figure 1E), except for the fact that the TrpA1-A+ neuron continued to respond to the repetitive IR-laser irradiations onto the identical location within the dendritic tree. (E) Effects of Nimodipine on the firing responses of neurons ectopically expressing dTrpA1-A, tested at three different output powers. The firing responses are presented as the spike density estimation computed by using a Gaussian filter kernel (σ = 12 ms) as in Figure 3—figure supplement 1C. The peaks and troughs of the spike density fluctuations clearly show the occurrences of USs clearly in the control neurons (left, blue traces). By contrast, the traces from Nimodipine-treated neurons display much flatter transitions (right, magenta traces). The red bars above the traces and the magenta shading indicate the timings of IR-laser irradiations. Genotype: w; 3×[ppk-TNXXL] (attP40)/+; UAS-dTrpA1-A/ppk-Gal4.
Figure 3—figure supplement 3. Dual recordings of firing responses from the soma and the axon bundle.

Figure 3—figure supplement 3.

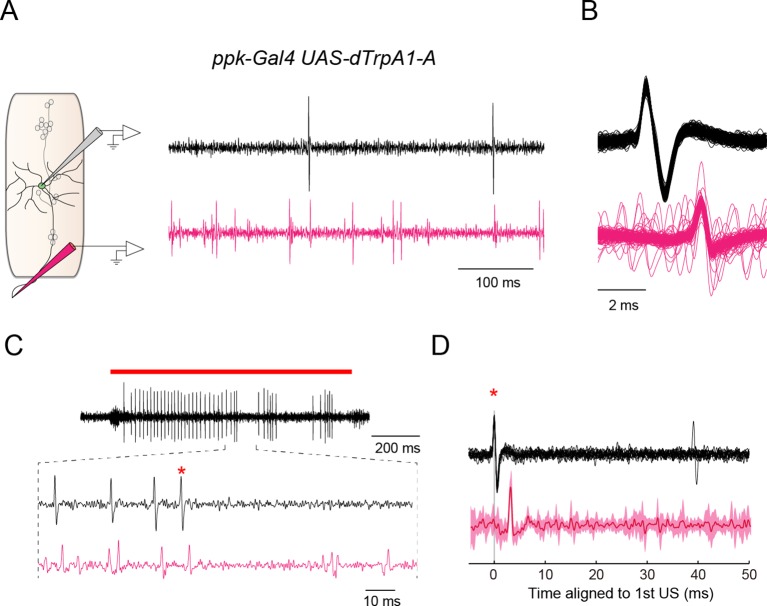
We performed dual extracellular recordings from the soma of a Class IV neuron and its axon bundle (black waveforms and magenta waveforms in (AD), respectively). (A) (Left) A schematic diagram of a subset of sensory neurons in a larval abdominal hemisegment, and pipets for the extracellular recording from the soma of a Class IV neuron (gray electrode) and the axon bundle (magenta electrode). (Right) An example of dual recordings of spontaneous activities. The upper black trace shows the recording from a soma; the lower magenta one displays that from the axon bundle. Spikes of variable amplitudes were observed in the trace from the axon bundle, which were presumably evoked in sensory neurons other than the Class IV. Genotype throughout this figure: w; 3×[ppk-TNXXL](attP40)/+; UAS-dTrpA1-A/ppk-Gal4. (B) The superposition of multiple waveforms from the dual recordings. The traces are aligned by the peak position of somatic spikes (black). Voltage traces from individual axon bundles (magenta) always contained spikes lagging those from the somata by an invariant latency. (C) An example of firing responses dually recorded from the soma (black) and the axon bundle (magenta) upon IR-laser irradiation of the proximal dendritic arbors (18 mW, 1 s; red bar above the traces). In the extracellular recording from the soma, the red asterisk identifies the second spike of the first US (cf. Figure 3C). We focused on voltage traces right after US to see whether US from soma were followed by pauses in firing from both the soma and the axon or not. Although it was difficult to detect such coinstantaneous pauses, due to the interference of predominant spikes of sensory neurons other than Class IV, we did find several instances where firing was paused from both an axon bundle and the corresponding soma. (D) The averaged waveforms of a part of the dual extracellular recordings that include the second spike of the US in C (red asterisks in C and D). The invariant dendritic location of the same cell was irradiated repeatedly by IR-laser as in C. The recordings from the soma of the same neuron were aligned at the spikes (red asterisk), and then the averaged values were computed. (Bottom) The solid magenta line indicates the average and the magenta shading represents the standard deviations of trials (n = 14 trials). When all of the voltage traces of axon bundles were aligned relative to the peak amplitudes of the first US from somata, the mean change of the voltage traces disclosed no additional spikes behind the US for 50 ms.