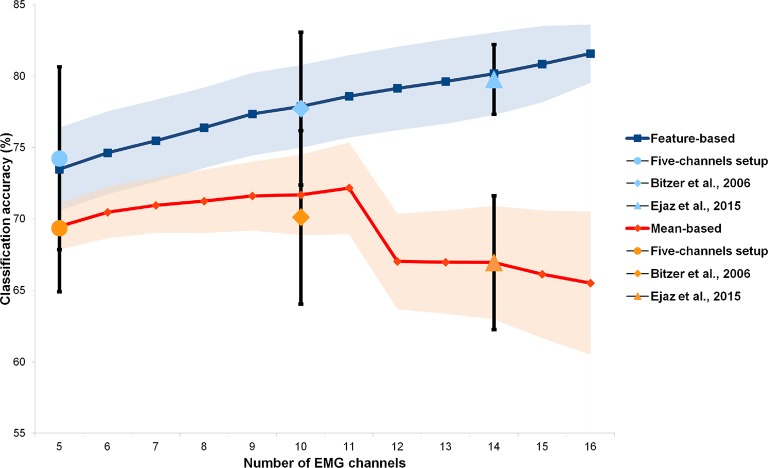
Appendix figure 2. Results of the rank accuracy procedure as a function of the number of EMG channels.
The red line shows the accuracy values for random configurations of 5 to 16 electrodes, using the mean-based preprocessing adopted by Ejaz et al. (2015). The orange dots represent the accuracy values for three fixed configurations. The blue line shows the accuracy values for 5 to 16 channels using the feature-based preprocessing (see Materials and methods); the light blue dots show the accuracy for three fixed configurations. Values are reported as mean across subjects ± SEM (error bars and bands).

