. 2016 Feb 15;5:e13420. doi: 10.7554/eLife.13420

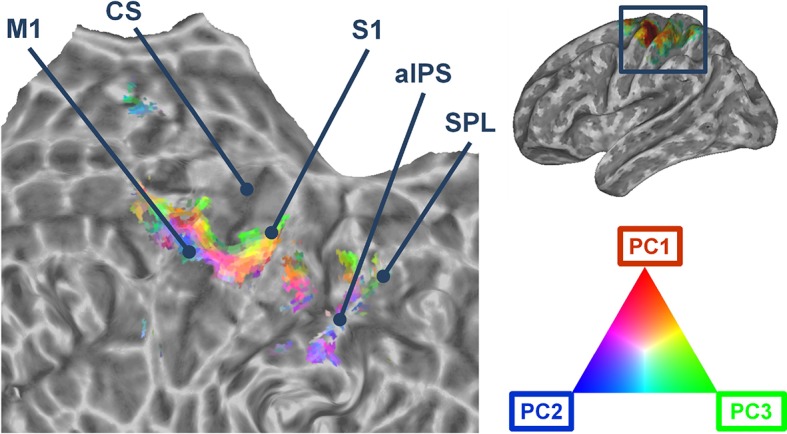
Figure 2. Cortical flattened map depicting the topographical organization of the first three synergies across primary motor, somatosensory, and parietal regions.

The portion of cerebral cortex represented in the map corresponds to the area enclosed in the rectangle in the brain mesh (top, right). M1: Primary Motor Cortex. CS: Central Sulcus. S1: Primary Somatosensory cortex (postcentral gyrus). aIPS: anterior intraparietal sulcus. SPL: Superior Parietal lobule.
DOI: http://dx.doi.org/10.7554/eLife.13420.007

Figure 2.

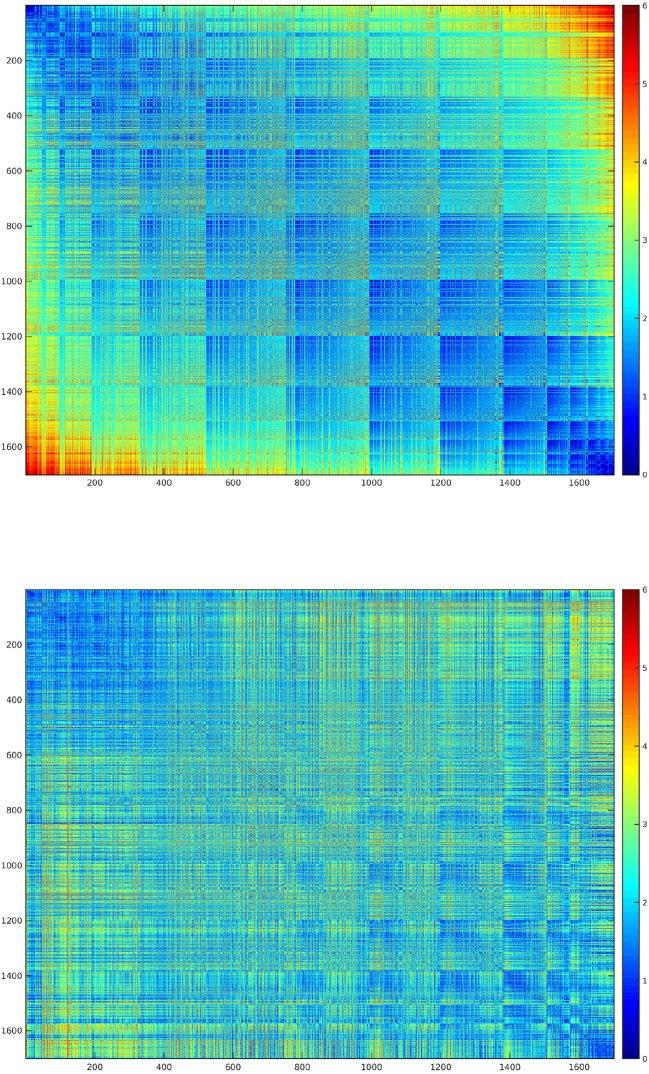
Figure 2—figure supplement 1. Topography assessment: map and feature spaces.

Figure 2—figure supplement 1.

The two maps represent the map space (upper image), which depicts the pairwise physical distance (i.e., standardized Euclidean distance) between the voxels of the results map, and the feature space (lower image), which depicts the distance (i.e., standardized Euclidean distance) between the goodness-of-fit (R2) of the first three kinematic PCs in each voxel. For further details, see Materials and methods and Yarrow et al., 2014. There was a significant similarity between the two spaces, assessed with the permutation test described in the Methods (C=0.192; p-value=0.0383). Voxels were reordered accordingly to their physical distance to improve readability of the two maps.