. 2016 Feb 15;5:e13420. doi: 10.7554/eLife.13420

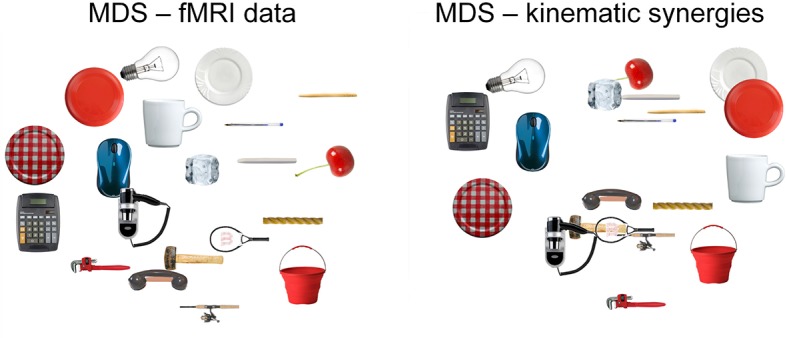
Figure 3. This picture displays the mMultidimensional sScaling (MDS) results for kinematic synergies (left) and fMRI brain activity (right).

With the exception of few postures (e.g., dinner plate, frisbee and espresso cup) that were misplaced in the fMRI data with respect to the kinematic synergies representation, the other object-related postures almost preserved their relative distances.
DOI: http://dx.doi.org/10.7554/eLife.13420.009

Figure 3.

Figure 3—figure supplement 1. Average correlations between behavioral models and fMRI data.
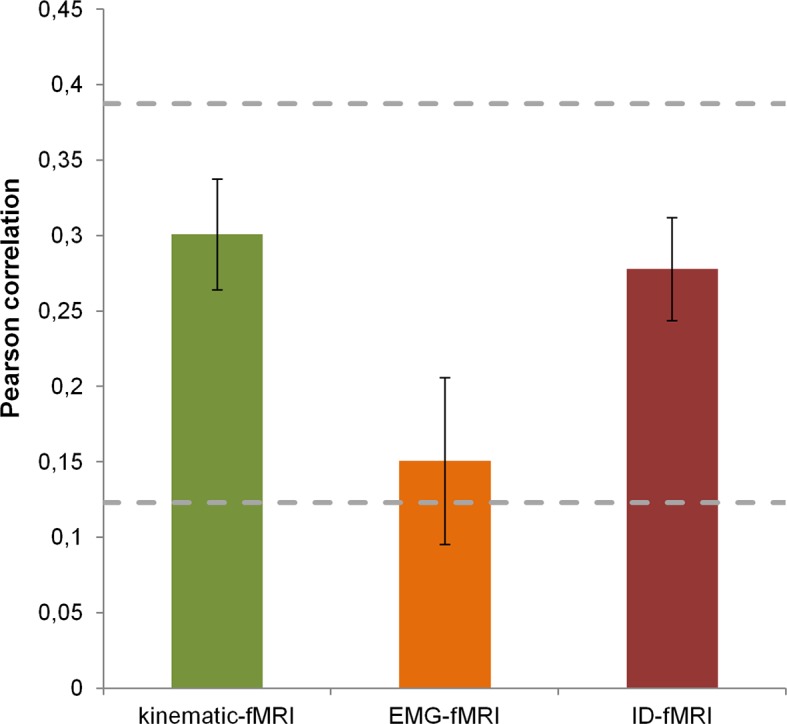
Figure 3—figure supplement 1.

The histogram reports the correlation values (transformed to z-scores and averaged across subjects) between each behavioral model and the fMRI data. Error bars represent the SEM. The noise ceiling, estimated using the procedure described by Ejaz et al., 2015 is also reported. The two dashed lines describe the upper and lower bounds, respectively. The single-subject correlation values are reported in Supplementary file 1D.