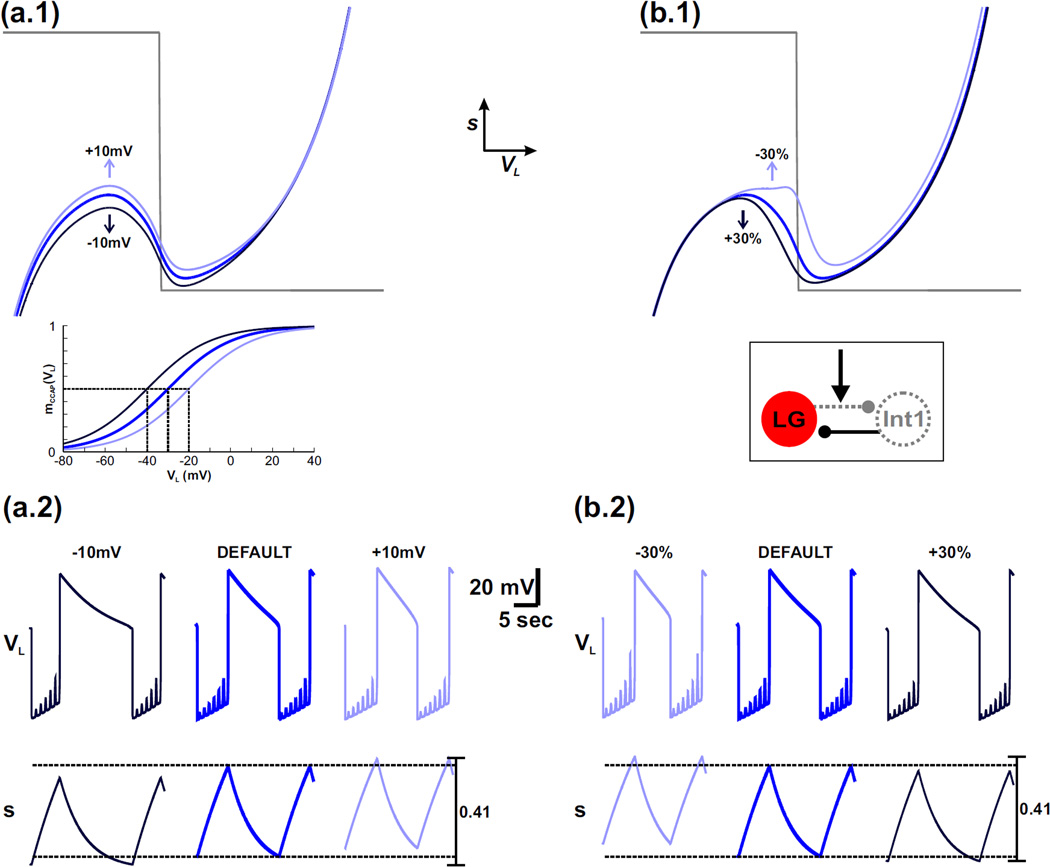
Fig. 6.
For the MI-BOTH model, varying the half-activation voltage of IMI-CCAP produces a similar effect on the network oscillations as varying the strength of the LG-to-Int1 inhibitory synapse. For simplicity, only the p = 1 (maximally forced) VL-nullcline is shown in the phase planes. (a.1) – (a.2) The effect of varying the half-activation voltage of IMI-CCAP. The default VL-nullcline from Fig. 5(a.2) is shown in blue. The darker and lighter blue VL-nullclines correspond to when the half-activation voltage of IMI-CCAP is shifted to the left and right, respectively, by 10 mV. The mCCAP(VL) activity trace is shown in the inset with the same corresponding colors for each case, and the horizontal line in the inset indicates the half-maximum point of mCCAP(VL). Also, in the s-trace of (a.2) the horizontal dashed lines correspond the minimum and maximum values of s. (b.1) – (b.2) The effect of varying the strength of the LG-to-Int1 inhibitory synapse. The default VL-nullcline is the same as in (a.1). The darker and lighter blue VL-nullclines correspond to increasing and decreasing the strength of this synapse, respectively, by 30%. This synapse is activated only during the LG active phase, so it has little effect on the VL-nullcline for low values of VL. A circuit diagram is shown in the inset. The synapse is shown as a gray dotted line in the circuit diagram (arrow in the inset) because its influence was mathematically absorbed into VL in the reduction to a 2-dimensional model (see text). For the default case in (a.2) and (b.2), the most hyperpolarized value of VL is −75 mV.

