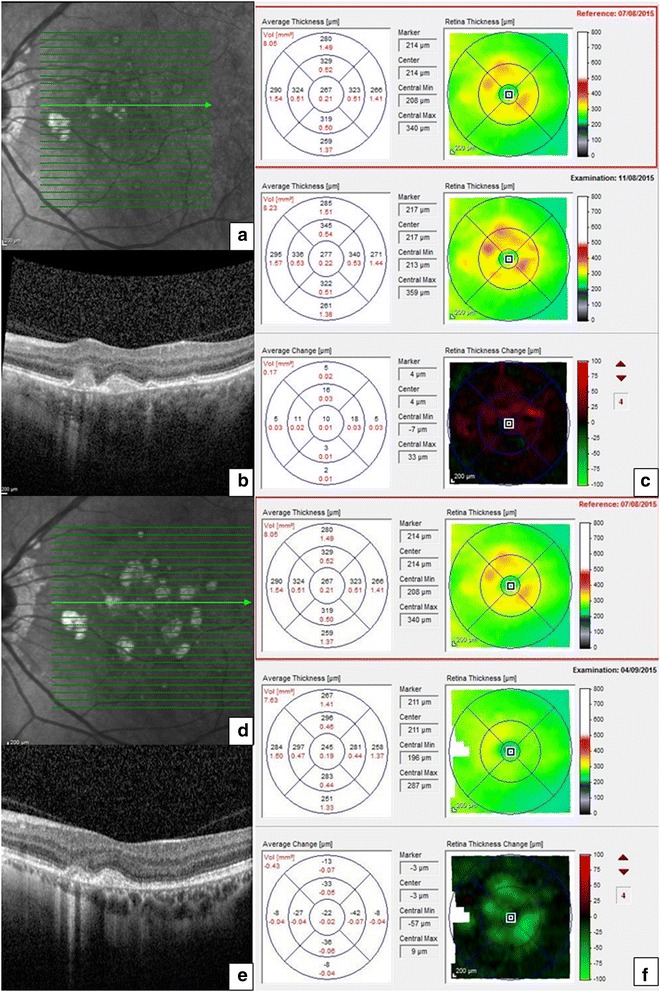
Fig. 1.

Comparative retinal thickness maps and SD-OCT images from an active and subsequent quiescent phase of punctate inner choroidopathy lesions in the patient’s left eye. SD-OCT during a symptomatic flare-up showing focal disruption of the RPE and ellipsoid zone associated with a dome-shaped hyperreflective area (a, b) and corresponding retinal thickness maps showing an increase in retinal thickness in the form of increase in the number, size and intensity of ‘hot spots’ compared to the reference with quantitative analysis of average change (c) in different subfields of the macular grid. SD-OCT was repeated 23 days after intravitreal triamcinolone for the above episode showing involution of the active lesion (d, e) and resolution of the hot spots on the corresponding retinal thickness maps compared to the same reference scan, together with quantitative analysis of the average change in retinal thickness (f)
