
Figure 6.
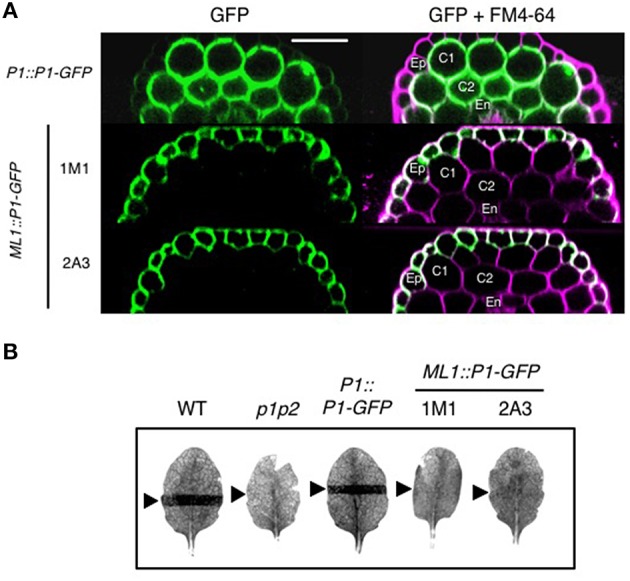
Epidermal-specific expression of phot1-GFP in ML1::PHOT1-GFP transgenic lines. (A) Phot1-GFP localization in hypocotyls of 3-day-old etiolated seedlings. Reconstructed hypocotyl cross sections of PHOT1::PHOT1-GFP (P1::P1-GFP) and ML1::PHOT1-GFP (ML1::P1-GFP) expressing seedlings. FM4-64 staining was used to define cell layers. Ep, epidermis; C1 and C2, cortex layers 1 and 2, respectively; En, endodermis. Scale bar, 50 μm. (B) Slit band assays of chloroplast accumulation in wild type (WT), phot1 phot2 mutants (p1p2) and plants expressing P1::P1-GFP and ML1::P1-GFP. Detached leaves were irradiation with 1.5 μmol m−2 s−1 of blue light through a 1 mm slit for 60 min. Arrows indicate irradiated areas.