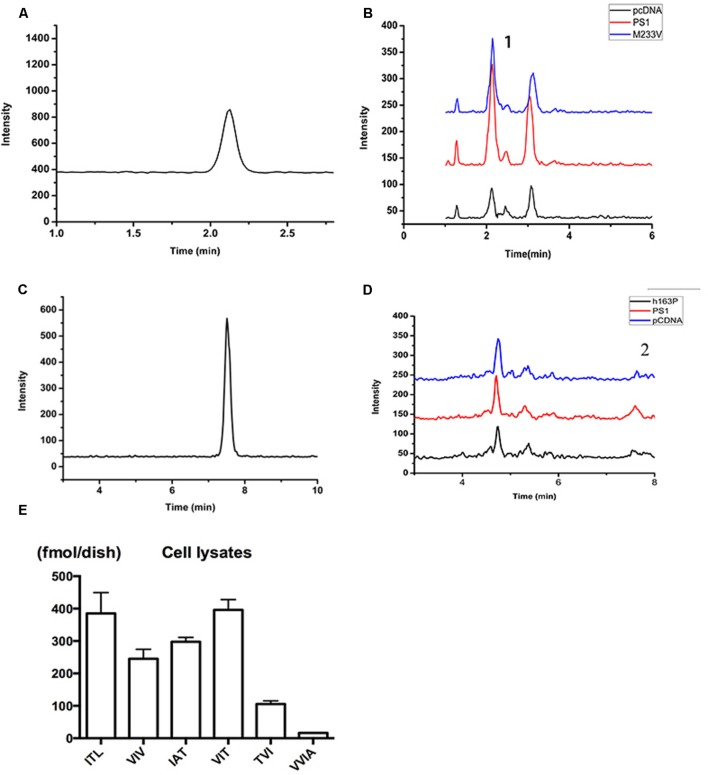
FIGURE 3.
Detection of related small peptide species of Aβ. (A) The chromatographys of IAT standard peptides. (B) The Intensity of multiple reactions monitoring (MRM) ion chromatography of ITA. (1) Its transition is m/z = 303.7/185. Black, pCDNA4.1; Red, PS1; Blue, M233V. (C) The chromatographys of VVIA standard peptides. (D) The Intensity of multiple reactions monitoring (MRM) ion chromatography of VVIA. (2) Its transition is m/z = 401.2/171.1. Black, pCDNA4.1; Red, PS1; Blue, M233V. (E) Aβ species in lysates of 2EB2 cells in a 10 cm dish overexpressing PS1 WT.

