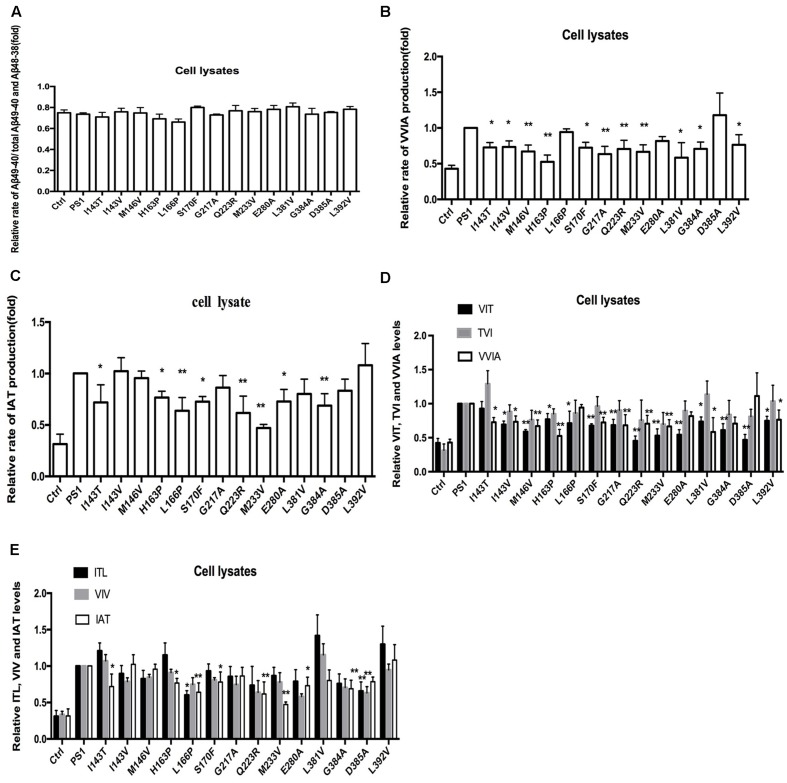
FIGURE 4.
Effects of PS-WT1 and PS1 Mutants on long Aβ Cleavage in 2EB2 cell line by LC-MS/MS. (A) Fold changes of the relative rate of Aβ49-40/total Aβ production. (B) Fold changes of the relative VVIA levels in cell lysates of 2EB2 cell line. (C) Fold changes of the relative IAT levels in cell lysates of 2EB2 cells line. (D) Fold changes of the relative VIT, TVI, and VVIA levels in cell line expressing PS1 and PS1 FAD mutants. (E) Fold changes of the relative ITL, VIV, and IAT levels in cell line expressing PS1 and PS1 FAD mutants. ∗P < 0.05; ∗∗P < 0.01.

