
FIGURE 5.
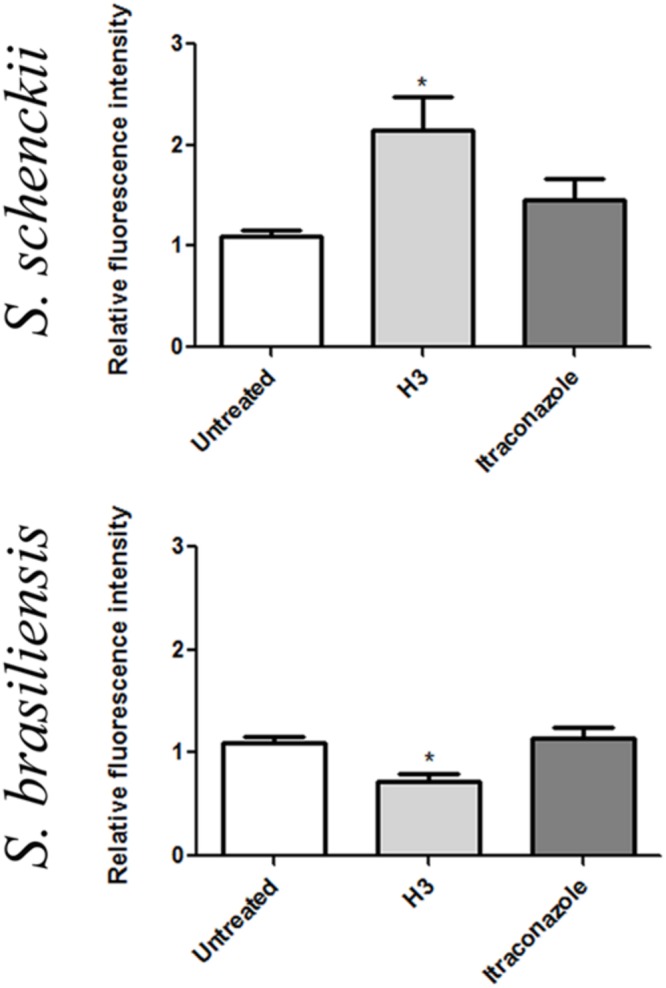
Mitochondrial activity after treatment of Sporothrix schenckii ATCC MYA 4821 and S. brasiliensis ATCC MYA 4823 yeast cells with H3 or itraconazole. Cells untreated or treated for 96 h with sub-inhibitory concentrations of H3 or itraconazole were stained with MitoTracker Red CMXRos, after which fluorescence intensity was analyzed by flow cytometry. H3 exposure induced a statistically significant fluorescence intensity increase (S. schenckii 4821) or decrease (S. brasiliensis 4823), reflecting mitochondrial disturbance (∗p < 0.05).