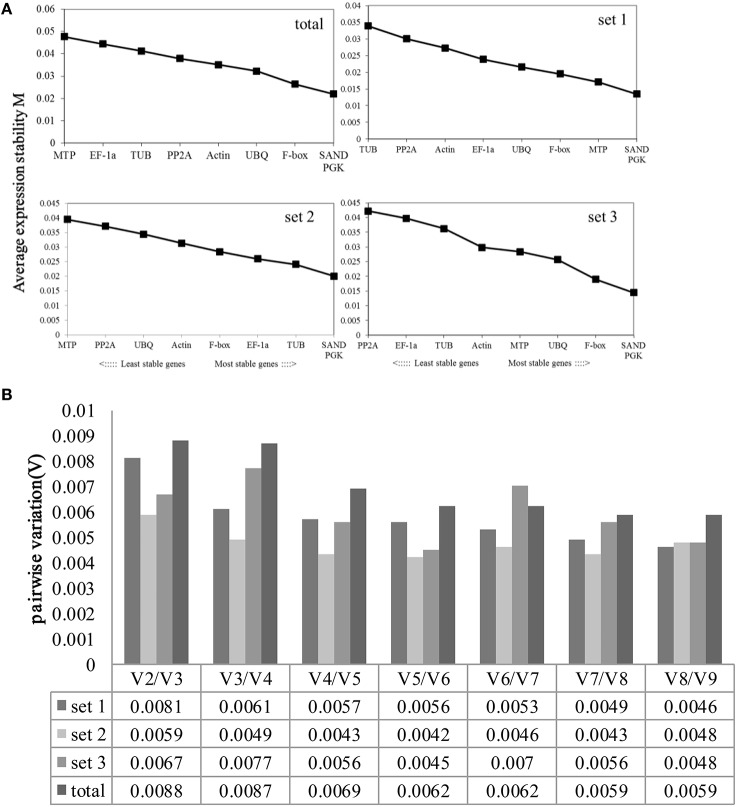
Figure 3.
Average expression stability values (M) and pairwise variation (V) of the candidate reference genes were calculated using GeNorm. (A) Average expression stability values (M) following stepwise exclusion of the least stable gene across all treatment groups. The least stable genes are on the left, while the most stable genes are on the right. (B). The optimal number of reference genes required for effective normalization. The pairwise variation (Vn/Vn+1) was analyzed between the normalization factors NFn and NFn+1 using GeNorm.

