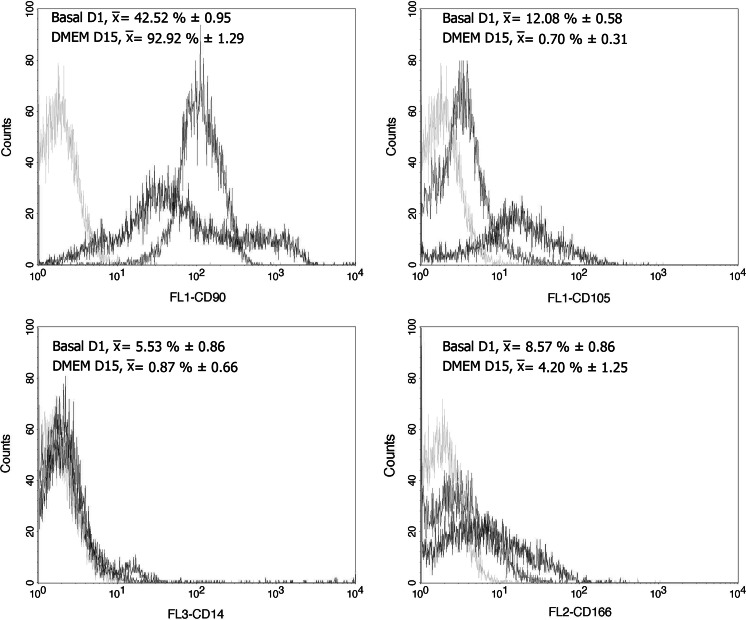
Fig. 5.
Immunophenotyping of CD90+ cells isolated from MPB. Data represent the percentage of positive cells for each fluorochrome that was conjugated with each of the monoclonal antibodies used, against the number of events detected. Gray peak, isotype control; red peak, basal CD90+ cells before cryopreservation (Basal D1); green peak, CD90+ cells after thawing in primary culture for 15 days (DMEM D15). (Color figure online)

