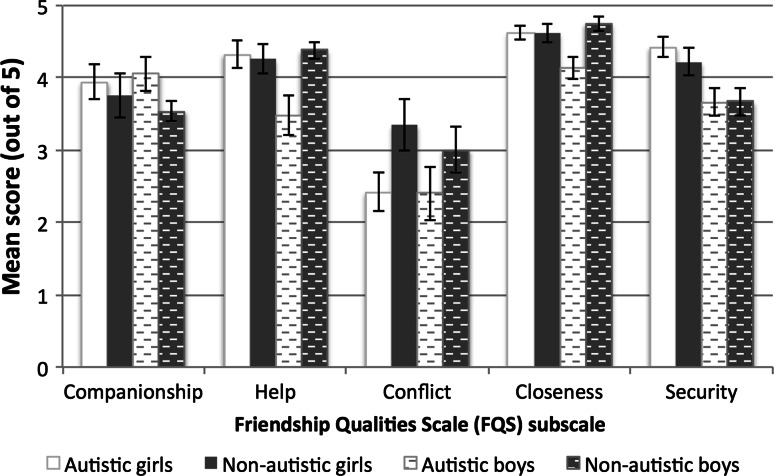
Fig. 1.
Graph shows adolescents’ mean scores for the Friendship Qualities Scale (FQS) by subscale as a function of gender and diagnostic status. Autistic and non-autistic adolescents are shown in white and grey, respectively (girls: solid bars; boys: patterned bars). Scores on the FQS ranged from 1 (‘not true at all’) to 5 (‘very true’). Error bars represent ± 1 standard error of the mean

