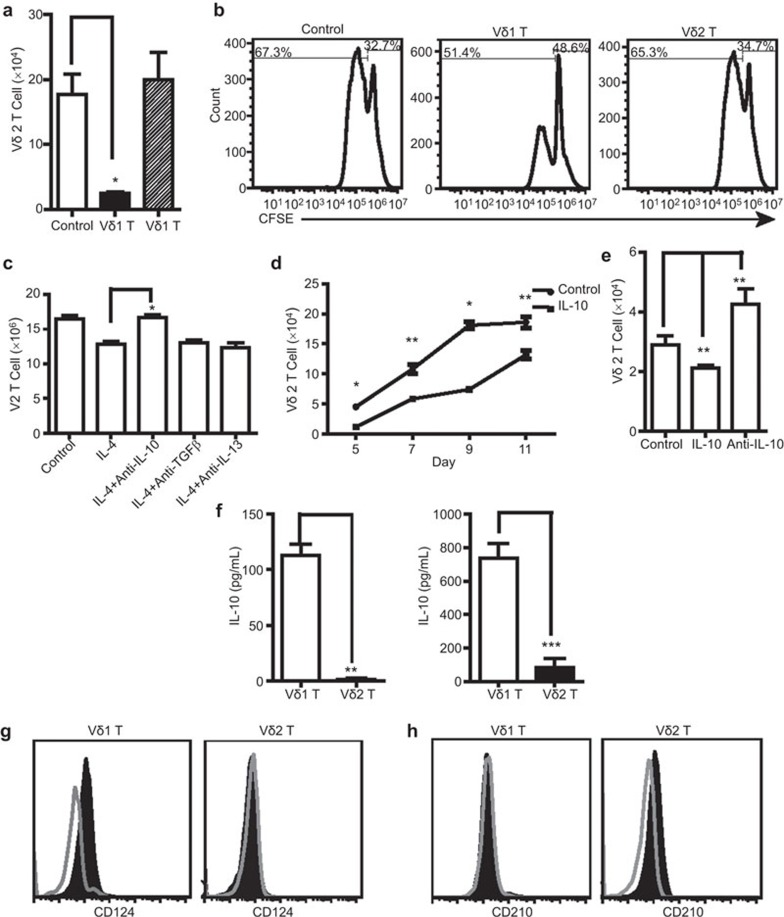
Figure 5.
IL-4 induced the Vδ1 T-cell bias through IL-10 production by Vδ1 T cells. (a) Purified Vδ1 T cells (>90%) and Vδ2 T cells (>92%) were obtained through magnetic bead sorting and used as effector cells, which were placed in the upper chamber. Fresh PBMCs were expanded by immobilized anti-human TCR PAN γδ mAb in the lower chamber. The ratio of effector to responder cells was 3∶7. After 10-day incubation, the Vδ2 T cells in the lower chamber were counted by flow cytometry. The data represent one of three independent experiments. *P<0.05. (b) The transwell assay was performed as described above except that fresh PBMCs in the lower chamber were labeled with CFSE. The data demonstrate the growth of Vδ2 T cells under the effect of Vδ1 T cells or Vδ2 T cells in the upper chamber. The data represent one of three independent experiments. (c) Anti-TGF-β mAb, anti-IL-13 mAb or anti-IL-10 mAb was added into the system described in Figure 4a. The absolute number of Vδ2 T cells after 10 days culture was analyzed by flow cytometry. *P<0.05. (d) Vδ2 T cells were activated by pamidronate disodium and treated with IL-10 (10 ng/ml). Vδ2 T cells were counted by flow cytometry at different time points. The data represent one of three independent experiments. *P<0.05, **P<0.01. (e) Vδ2 T cells were activated by pamidronate disodium and treated with IL-10 (10 ng/ml) or anti-IL-10 mAb. Vδ2 T cells were counted at the fifth day by flow cytometry. The data represent one of three independent experiments. *P<0.05, **P<0.01. (f) Vδ1 T cells and Vδ2 T cells were expanded by anti-TCR γδ mAb in the presence of IL-4 and IL-2. Purified Vδ1 T cells (>90%) and Vδ2 T cells (>92%) were obtained through magnetic beads sorting and cultured in RPMI 1640 without IL-2 and IL-4. The secretion levels of IL-10 from the rested (left panel) or activated (right panel) Vδ1 T cells or Vδ2 T cells at 24 h were examined by ELISA or Milliplex method. **P<0.01 and ***P<0.001. Vδ1 T cells were activated by anti-TCR PAN γδ antibody and cultured with or without IL-4. Vδ2 T cells were activated by zoledronic acid and cultured with or without IL-4. CD 124 staining (g) and CD 210 staining (h) on Vδ1 T cells and Vδ2 T cells were performed. Open histograms represented the activated Vδ1 T cells or Vδ2 T cells. Shaded histogram represented the activated Vδ1 T cells or Vδ2 T cells treated with IL-4. PBMC, peripheral blood mononuclear cell; TCR, T-cell receptor.

