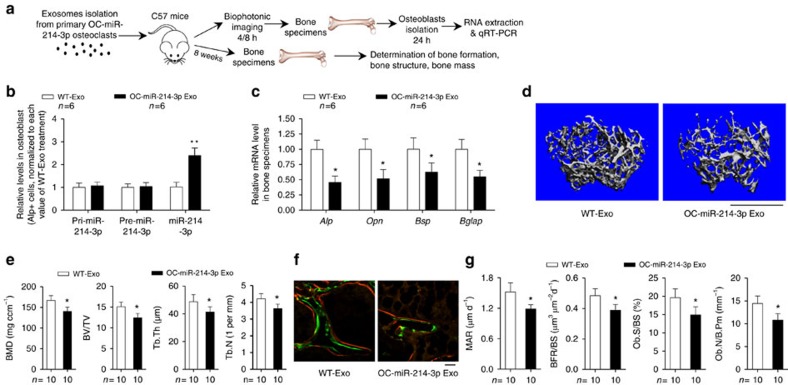
Figure 8. Osteoclast-derived exosomal miR-214-3p inhibit bone formation.
(a) A schematic diagram illustrating the experimental design. The female C57BL/6 mice were intravenously injected with purified exosomes derived from either OC-miR-214-3p (OC-miR-214-3p Exo) or WT (WT-Exo) osteoclasts. (b) Real-time PCR analysis of the levels of either pri-miR-214, pre-miR-214 or miR-214 in ALP+ cells (osteoblasts) isolated from bone marrow cells by fluorescence-activated cell sorting at 24 h after the mice were intravenously injected with either OC-miR-214-3p Exo or WT-Exo. (c) Real-time PCR analysis of the mRNA expression levels of Alp, Opn, BSP and Bglap in femurs from the mice administered with either OC-miR-214-3p Exo or WT-Exo, respectively. (d) Representative micro-CT images of the distal femur metaphysis from the mice administered with either OC-miR-214-3p Exo or WT-Exo. Scale bar, 1 mm. (e) The values of micro-CT parameters (BMD, BV/TV, Tb.Th and Tb.N) at the distal femur metaphysis from the mice administered with either OC-miR-214-3p Exo or WT-Exo, respectively. (f) Representative images of new bone formation assessed by double labelling with calcein green and xylenol orange at the distal femur metaphysis from the mice administered with either OC-miR-214-3p Exo or WT-Exo. Scale bars, 10 μm. (g) The values of bone histomorphometry parameters (MAR, BFR/BS, Ob.S/BS, Ob.N/B.Pm) at the distal femur metaphysis from the mice administered with either OC-miR-214-3p Exo or WT-Exo, respectively. The n value for each group is indicated at the top/bottom of each histogram. All data are the mean±s.d. *P<0.05 versus WT. Student's t-test was performed.

