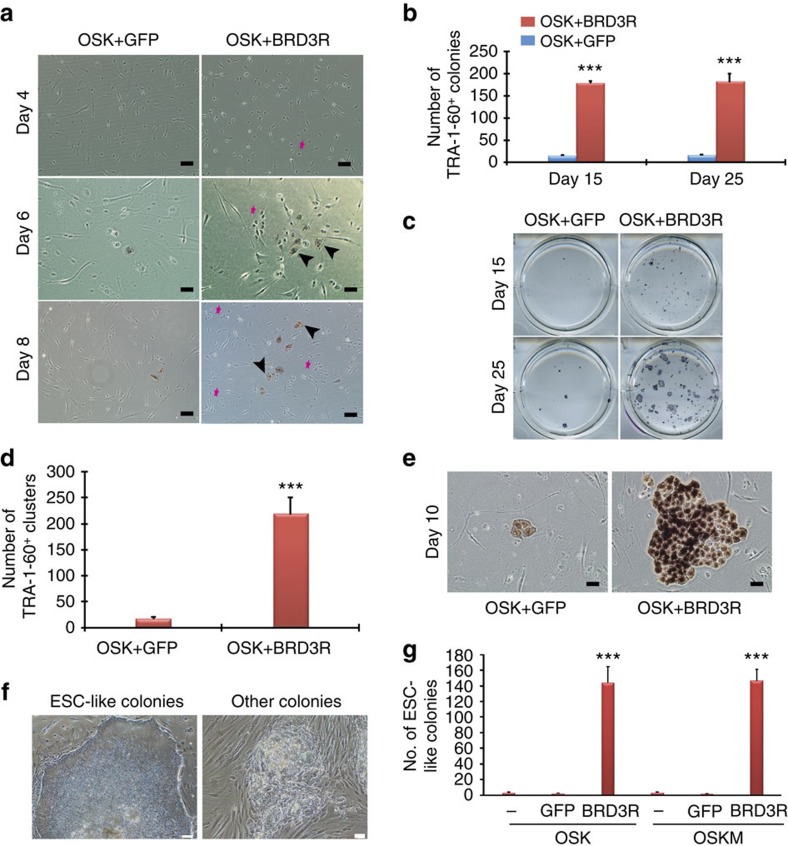
Figure 2. BRD3R speeds up reprogramming kinetics and enhances the quality of reprogramming.
(a) Representative images showing early appearance of TRA-1-60+ clusters in BRD3R reprogramming. Arrowhead, TRA-1-60+ clusters; magenta star, compact rounded cells resembling mitotic cells and ESC morphology. (b) Significant higher TRA-1-60+ colonies in middle stage of reprogramming (day 15) (n=3; mean ± s.d.; ***P<0.001; t-test). (c) Representative images of reprogramming dishes stained for TRA-1-60 on day 15 and day 25 from experiments in b. Note the larger colonies in BRD3R reprogramming. (d) Significantly more TRA-1-60+ clusters are found at early stage of reprogramming (day 10) (n=3; mean±s.d.; ***P<0.001; t-test). (e) Representative images of the TRA-1-60+ clusters from experiments in d to show the larger size of clusters in BRD3R dishes. (f) Representative images of ESC-like colonies (left) and low-quality colonies (right) on which the quantification in g was based. ESC-like colony has clear border with smooth colony surface and contains homogeneous cells, whereas the low-quality colonies have ragged colony border and surface, and contain heterogeneous cells. (g) BRD3R reprogramming generated more ESC-like colonies in the primary reprogramming dishes (n=3; mean±s.d.; t test). (a,e) Scale bar, 50 μm; (f) Scale bar, 100 μm.

