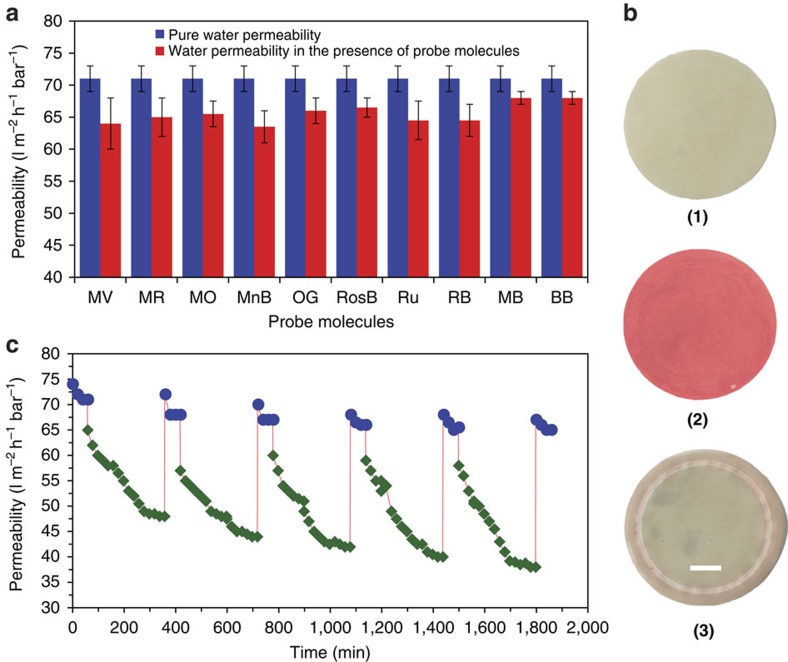
Figure 6. Flux regeneration in SAM.
(a) Permeability declined during the filtration tests with probe molecules. The results show that a maximum of 10% decline is observed, it is larger for small molecules (methyl viologen ∼10% reduction), and less for bigger probe molecules (∼4.2% for methyl blue and brilliant blue) consistent with minimal sorption effects. Error bars are from five measurements showing the maximum and minimum values. (b) Photographs of the membrane before (1) and after filtration (2) of methyl red, and after the cleaning process (3) which shows regeneration of the parent-membrane surface (scale bar, 1 cm). (c) Demonstration of long-term viability, low-fouling behaviour of the membranes during filtration of BSA and flux recovery after chemical cleaning in five cycles. Each cycle commences with RO water permeation (Blue symbols), followed by permeation of BSA (Green symbols). Error bars in these figures are from five measurements showing the maximum and minimum values.

