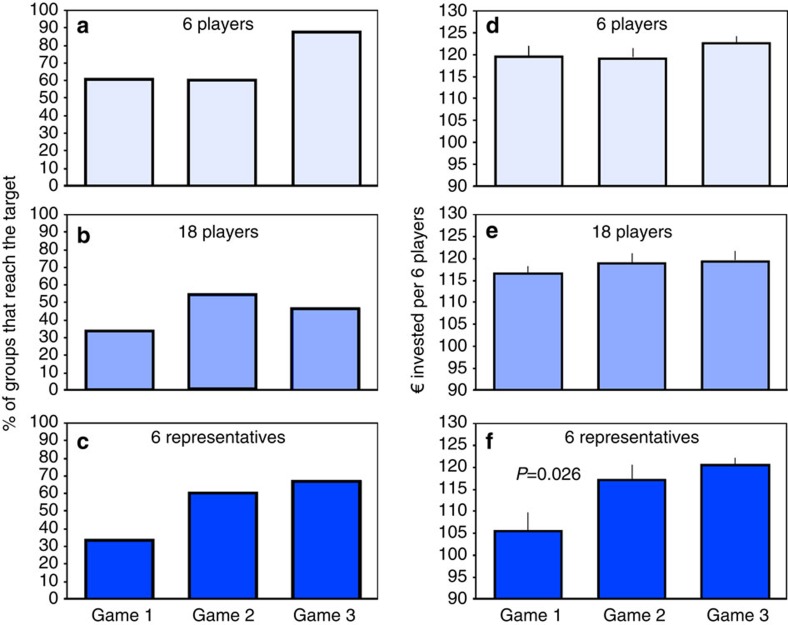
Figure 2. Group success in reaching the target sum (left) and group investments (right).
(a,d) Six-players treatment; (b,e) 18-players treatment; (c,f) 6-representatives treatment. In f, the sum invested is divided by 3 to allow comparison among treatments. Means±s.e.m. of 15 groups per game and treatment are shown. See text for statistics.

