FIGURE 1.
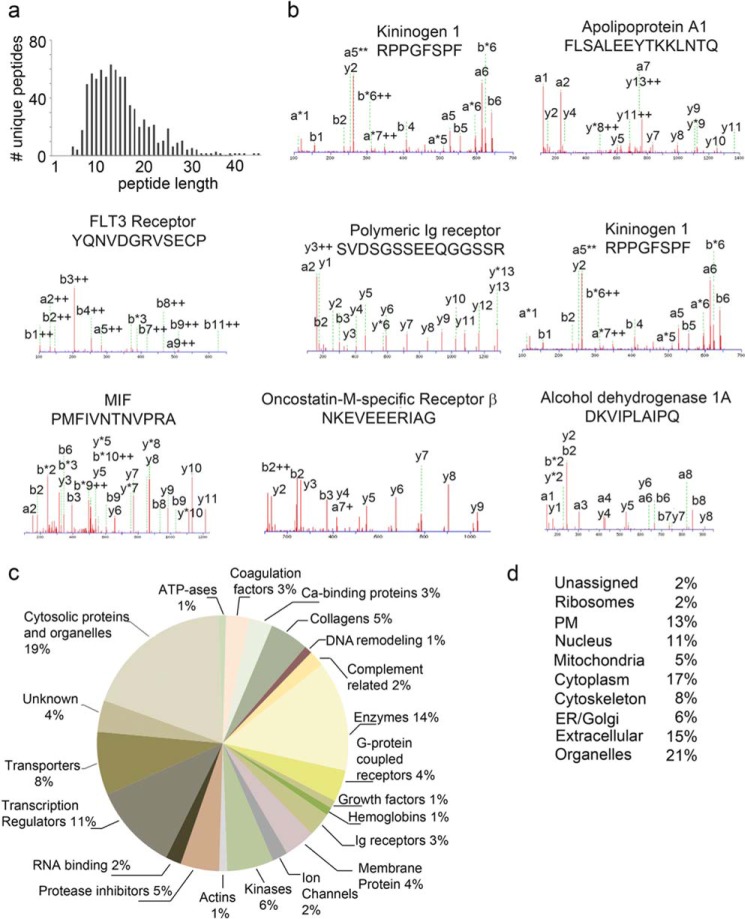
MS/MS characterization of the lymph peptidome. a, scattergram of the lymph peptidome. The x axis shows peptide amino acid length and the y axis the number of unique peptides for each of the amino acid lengths. Only peptides with a PEAKS score above identity (above a 1% FDR) are reported and analyzed further. b, examples of MS/MS fragmentation of peptides with a PEAKS score above identity. c, pie chart showing the ingenuity pathway analysis of the protein functions comprised in the lymph peptidome. d, list of the subcellular location of proteins comprised in the lymph peptidome, reported as a percentage of the total proteins.

