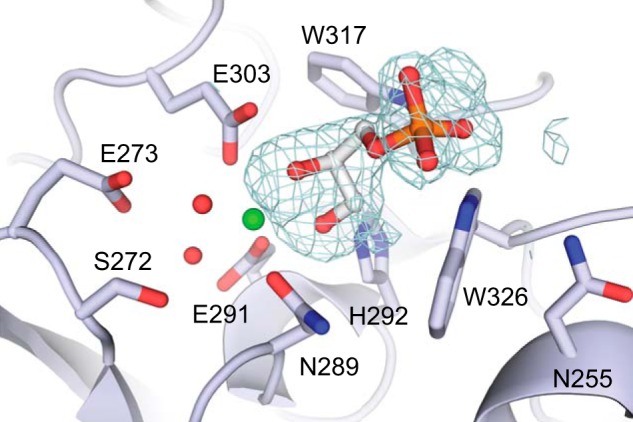
FIGURE 4.

Crystal structure of XEELCRD-GroP complex. Calcium ion and ordered water molecules are shown in green and red, respectively. The mesh represents the 3σ contour in a difference electron density map (mFo − DFc, where m is figure of merit, and D is σA weight) after refinement without ligand.
