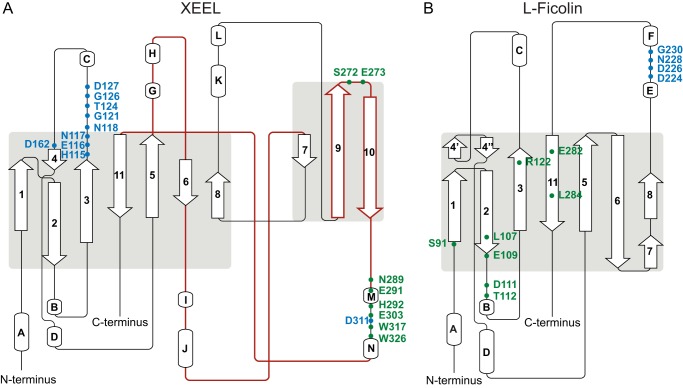
FIGURE 6.
Topology diagram of XEEL (A) and l-ficolin (PDB ID: 2J3U) (B), highlighting residues in the structural calcium sites (blue) and ligand-binding sites (green). Regions found in XEEL but not in L-ficolin correspond roughly to the brown traces in XEEL. Images were generated using Pro-origami (61).

