
FIGURE 9.
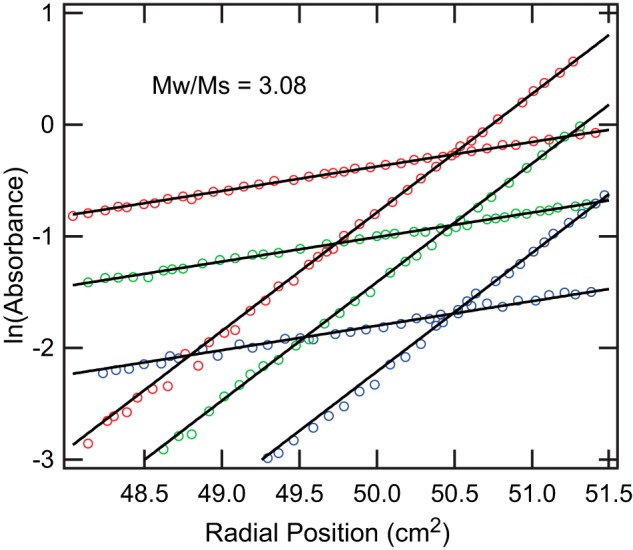
Sedimentation equilibrium analytical ultracentrifugation of XEELCRD. ln(absorbance) versus radial position squared (cm2) plot of XEELCRD at 6,000 rpm (lower slope) or 13,200 rpm (higher slope) for each XEELCRD concentration (2.6 μm (blue), 5.2 μm (green), and 9.0 μm (red)). Only every third raw data point is shown for clarity. The solid lines represent the single species fit of the data used to calculate the reduced mass.