FIGURE 5.
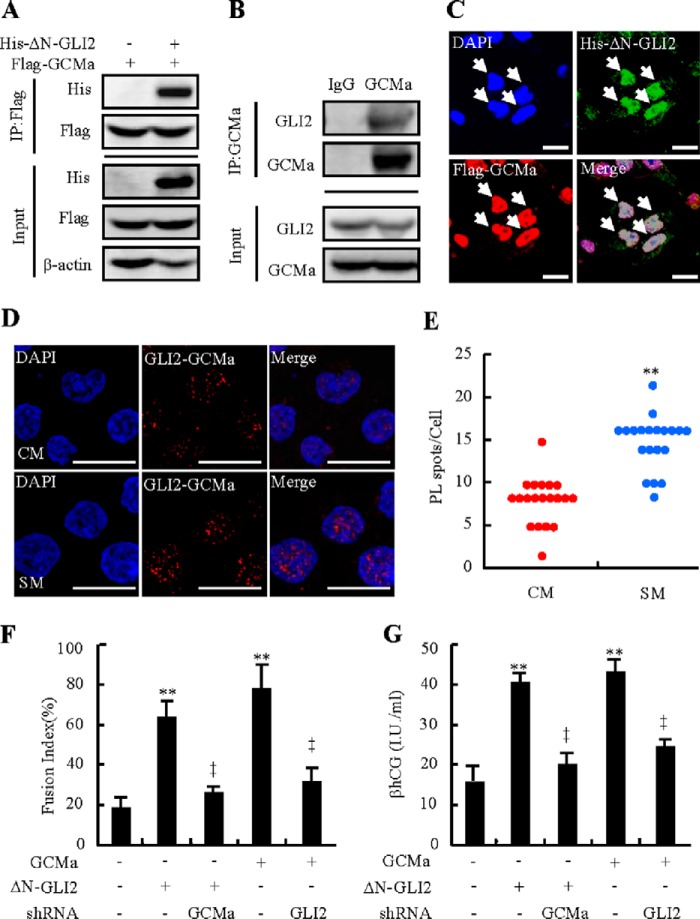
Complex formation of GLI2 and GCMa. A, co-immunoprecipitation of FLAG-tagged GCMa and His-tagged ΔN-GLI2 in HEK293T cells. Immunoprecipitation (IP), α-FLAG; Western blotting, α-His. B, co-immunoprecipitation of endogenous GCMa and GLI2 in BeWo cells. Immunoprecipitation, GCMa; Western blotting, GLI2. C, immunofluorescent staining of His-tagged ΔN-GLI2 and FLAG-tagged GCMa in HEK293T cells. D, in situ proximity ligation assay in CTBs after treatment with SM or CM for 48 h. Red spots indicate the GLI2-GCMa interaction. Nuclei were stained with DAPI (blue). E, quantitative analysis of the proximity ligation (PL) assay spots (n = 20). F and G, fusion index and βhCG production after BeWo cells were transient transfected and infected with the indicated plasmids and lentiviruses. RNA and protein abundance were normalized to β-actin. ** and ‡, p < 0.01 versus CM, empty vector with control shRNA, ΔN-GLI2 with control shRNA, or GCMa with control shRNA; n = 6. Error bars show mean ± S.D. Scale bars = 20 μm (C) and 80 μm (D).

