
FIGURE 1.
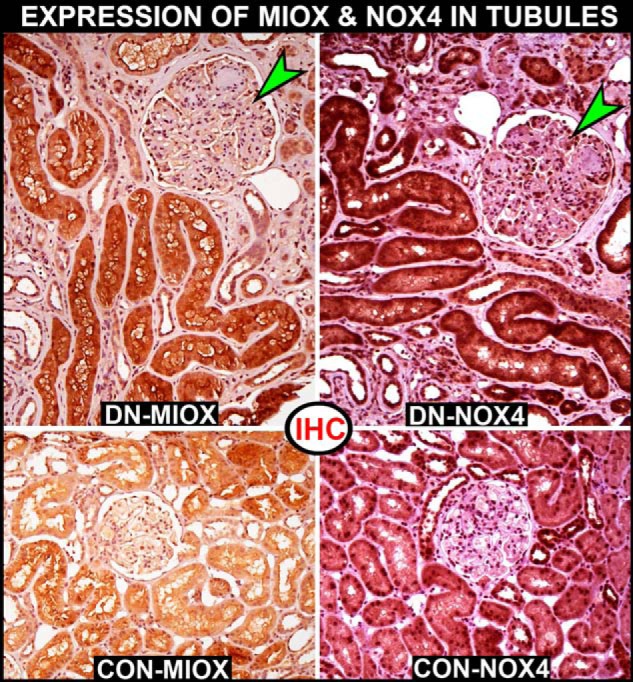
Expression of MIOX and NOX4 in human DN, as assessed by immunohistochemistry (IHC). An increased expression of MIOX is seen in the “hypertrophic renal tubules” of a patient with DN (top left), as compared with a control non-diabetic patient (bottom left). Concomitantly, an increased expression of NOX4 is seen in the identical region of tubules in the patient with DN (top right). The control shows a very low level of NOX4 expression in the renal tubules (bottom right). The glomeruli of the DN patient show typical lesions of diabetic nodular glomerulosclerosis, but no increase in the expression of either MIOX or NOX4 (green arrowheads) is seen.