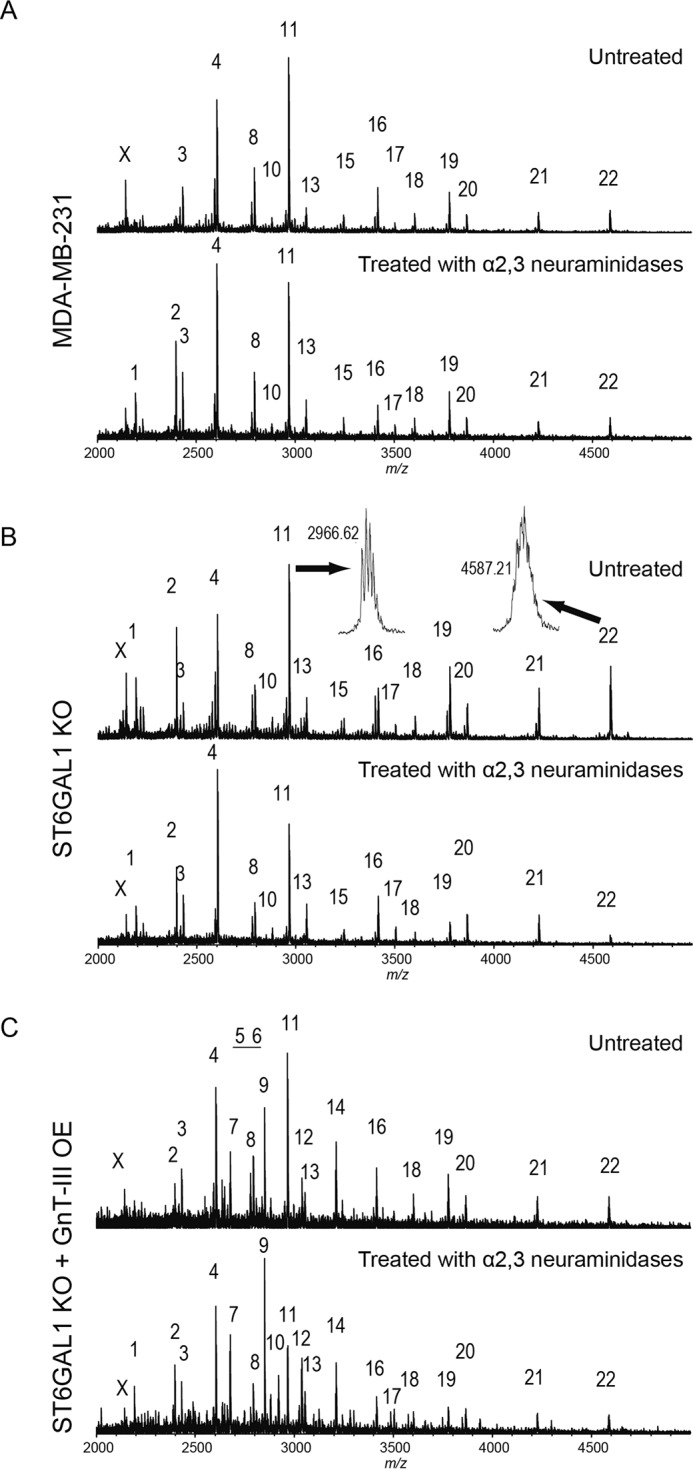
FIGURE 2.

MALDI MS spectra of N-glycans of membrane fractions from MDA-MB-231 cells and their genetically modified cells. Each bottom panel shows the MS spectrum after α2,3-neuraminidase digestion. Observed glycan peaks are numbered and summarized in Table 1. The peaks indicated with X are assigned to in-source decay fragments of glycans. Representative examples of peak resolution are shown in B. A, MDA-MB-231 cells. B, ST6GAL1 knock-out MDA-MB-231 cells (ST6GAL1 KO). C, GnT-III-overexpressing ST6GAL1 knock-out MDA-MB-231 cells (ST6GAL1 KO + GnT-III OE).
