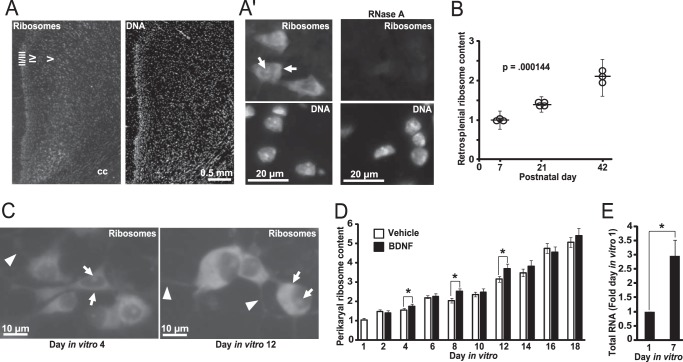
FIGURE 2.
Neuronal maturation-associated increase of the perikaryal ribosome pool. A and B, brain sections cut through the dorsal hippocampus were used for ribosome staining with NeuroTrace 500/525 Green. DNA was counterstained with Hoechst-33258. A, representative images of the retrosplenial cortex at P42; cortical layers are indicated by roman numerals; cc, corpus callosum. A′, representative images of layer five neurons from that region. As expected, ribosomal signal is present in perikarya and nucleoli (arrows); moderately stained proximal dendrites were also observed at higher exposure times (data not shown). Ribosomal nature of the NeuroTrace signal was further confirmed by its disappearance on sections that were pre-incubated with RNase A. B, fluorescence intensity (FI) of the ribosomal and the DNA signal was determined in layers 4–5 of the retrosplenial cortex. Equally exposed and non-saturated images were used; for each animal, three sections were analyzed; cortical architecture was revealed by the NeuroTrace staining, and the entire region of interest was marked for FI measurements. Fold change was calculated for each individual FIribosome/FIDNA ratio by normalization to the mean FIribosome/FIDNA ratio of the P7 group. Ribosome content increased during postnatal development of the retrosplenial cortex. On the graph, circles represent values from individual animals, and the vertical lines indicate the means ± S.E., p value for the effect of age is indicated (Kruskal-Wallis ANOVA). C and D, ribosome/DNA staining was performed on fixed rat hippocampal neurons that were isolated from newborn pups and maintained in dissociated culture for the indicated time. In addition, some cultures were maintained in the medium that was supplemented with BDNF (10 ng/ml added on DIV1 and then 5 ng/ml fresh BDNF added every other day with each media change). C, representative images reveal perikaryal and nucleolar presence of ribosomes (arrows). In addition, a weak signal was detected in some dendrites in the immediate proximity to perikarya (arrowheads). D, perikaryal ribosome content kept increasing with neuronal maturation under cell culture conditions. Although BDNF-stimulated neurons appeared to have more ribosomes at some time points, the overall effect of the neurotrophin was small albeit significant (two-way ANOVA, effect of BDNF, F1,788 = 13.363, p < 0.001). Data represent means ± S.E. of at least 76 cells from three independent experiments; *, p < 0.05 (post hoc tests). E, neuronal maturation-associated expansion of ribosomes is indicated by increasing total RNA content as rRNA represents most of total cellular RNA. RNA content was normalized against DNA; data represent means ± S.E. from three independent experiments; *, p < 0.05, U test.

